Sub-Saharan Africa’s economy recovered slightly in 2017. With many of the region’s larger economies returning to growth after the drop in oil prices in 2015 and 2016, the region as a whole is estimated by the World Bank to have experienced 2.4% growth in 2017 and is expected to grow upwards of 3% in 2018. In contrast to their counterparts in the Middle East and North Africa, the region’s large oil exporters implemented measures to contain large fiscal deficits. As a result, imports in many countries, even in oil exporting economies such as Angola, have grown, suggesting stronger demand.
The trade outlook for the region over the next few years is largely positive, but there are several factors that will influence the extent of this positivity:
Political pressures: Sub-Saharan Africa’s growth is always at risk from tensions and political crises at an individual country level. While these do not necessarily affect overall growth, they do create a perception that the risks of investment in the region are high and affect growth at a national level. As an example, Kenya, despite its growing GDP and export volumes, has remained unstable since its 2017 elections and its border with Somalia continues to be hotly contested. This influences stability in the country, which is a precondition to sustained trade and investment. Elsewhere, recent tensions in the Democratic Republic of Congo and its outbreak of Ebola may weaken the growth that it has experienced over the past couple of years.
The role of China: The commentary on China’s Belt and Road Initiative (BRI) has been the focus for the Eurasia and Middle East and North Africa regions. However, there are both opportunities and risks for Sub-Saharan Africa too. For example, the economies of Kenya, Ethiopia and Tanzania may benefit from the infrastructure investment, not least because of their geographical proximity to the main planned maritime routes. There are broader infrastructure plans to move goods within Africa as well, but it’s worth noting that the infrastructure may simply improve trade through the region rather than creating economic benefits for individual nations of the region.
The role of regional free trade areas: The Africa Continental Free Trade Area was signed by 44 African leaders at the end of March. It is believed that the agreement will play an important role in boosting intra-African trade and, to a larger extent, political stability between neighbours across the continent.
Diversification away from oil: The region’s economy is divided into oil importers and oil exporters, and it is the oil exporters which have had to adjust their economies the most. However, the region also remains strong in soft commodity trade and even technology in countries like Kenya. This offers an opportunity to break from the commodity cycles and represents an area for substantial potential growth. Similarly, with investment into the region, Africa’s young workforce and relatively cheap labour compared to China, the scope for regional growth through manufacturing is growing.
Infrastructure: The region is rich in natural resources and has strong potential to grow through commodity trade but also through services and higher end manufacturing. However, the extent to which this will happen is still limited by the weak transport infrastructure, both within and between countries in the region.
Trade openness and links to GDP
Most of the countries in Sub-Saharan Africa are very open – that is, exports and imports account for a substantial proportion of GDP (Figure 1). This is a function of two factors: low GDP and the weakness of domestic demand, and a heavy reliance on imports for intermediate and tertiary manufactured goods and services. Trade is actually higher than GDP in countries such as the Republic of Congo, Lesotho, Liberia, Mozambique, Namibia, Togo and Swaziland, meaning that their domestic demand is lower than the value of trade passing through them. Where economies are larger or more self-sufficient, as is the case with Ethiopia and Kenya, the amount of trade in relation to GDP is lower. For South Africa, which is a more developed economy, the value of trade is 60% of its GDP. This reflects both its greater integration into the global trading system and its stronger domestic demand base.

Overall the region is highly open to international trade, which means that there is potential for leading economic development and growth through trade. However, much of this is likely to be driven in the short term through imports (Figure 2). For most of the countries in the region, GDP and imports are growing, which reflects a growth in demand in almost two-thirds of the countries in the region. Such import-led growth is only sustainable in the short term and relies on the development of a strong domestic infrastructure as well.

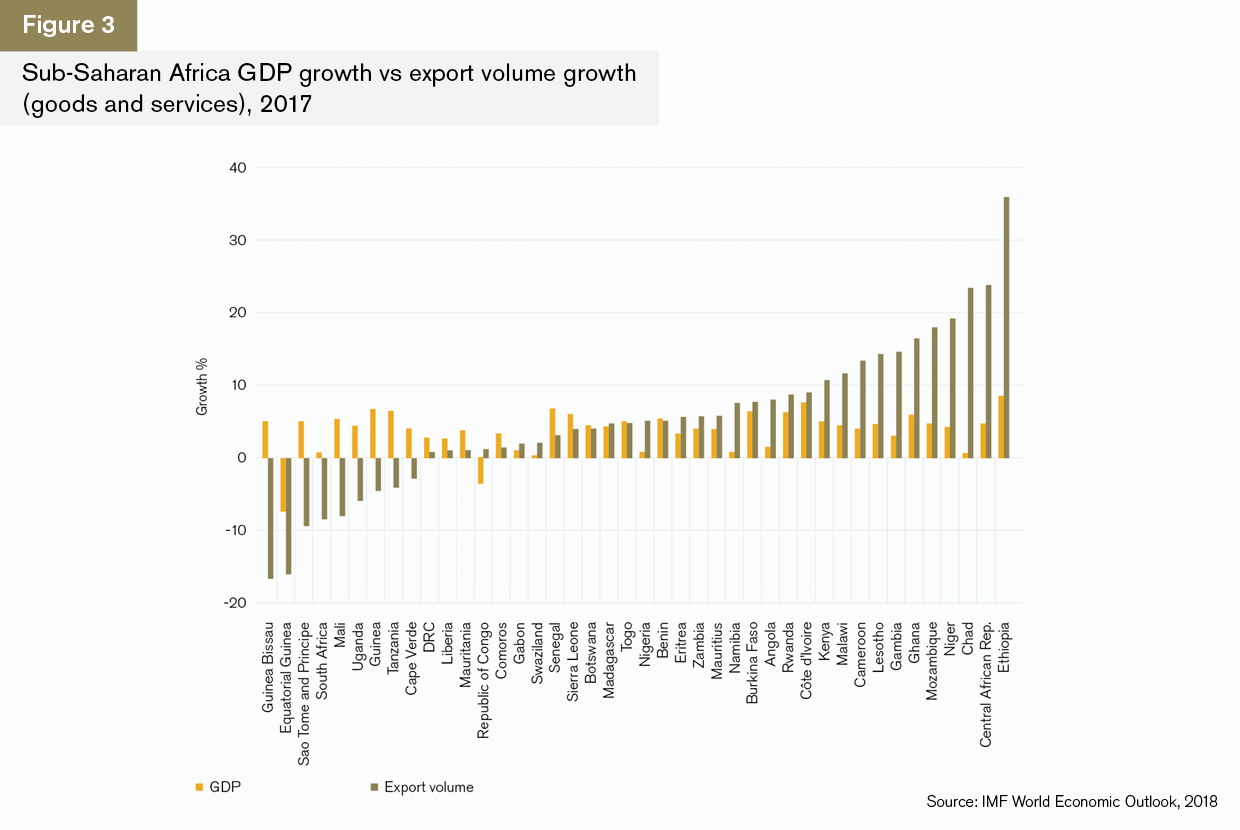
The link between GDP and export growth is strong in many Sub-Saharan African nations. Where export volume growth is less than GDP growth, as in Liberia, Senegal or Botswana, it indicates that exports have scope to promote growth (Figure 3). Where export volume growth is significantly higher than GDP growth, for example in Ethiopia, the Central African Republic, Chad, Niger, Ghana and Lesotho, it suggests that exports are driving growth. For countries where GDP growth is negative but exports are high, it is likely that exports are not feeding through into the domestic economy. This is worrying as it increases the dependency of these countries on outside development assistance rather than indigenous growth. The Republic of Congo falls into this category. Other countries where export volumes have fallen are likely to be those with a strong dependency on commodity prices for their exports.
Data reliability – Africa’s challenge
Reporting on trade in Sub-Saharan Africa has historically been difficult. The countries in the region have reported their data unreliably, and these weaknesses were a key theme of last year’s GTR+ Africa report. This remains the case this year, as illustrated in Figure 4, which shows the average divergence between what a country says it is trading in its nationally available data, and what Coriolis Technologies finds it is trading when its trade flows reported by partner countries are taken into account. This involves a process of averaging trade flows, weighting the data in favour of the better reporting country. Countries missing from the graph had not reported their 2016 trade.
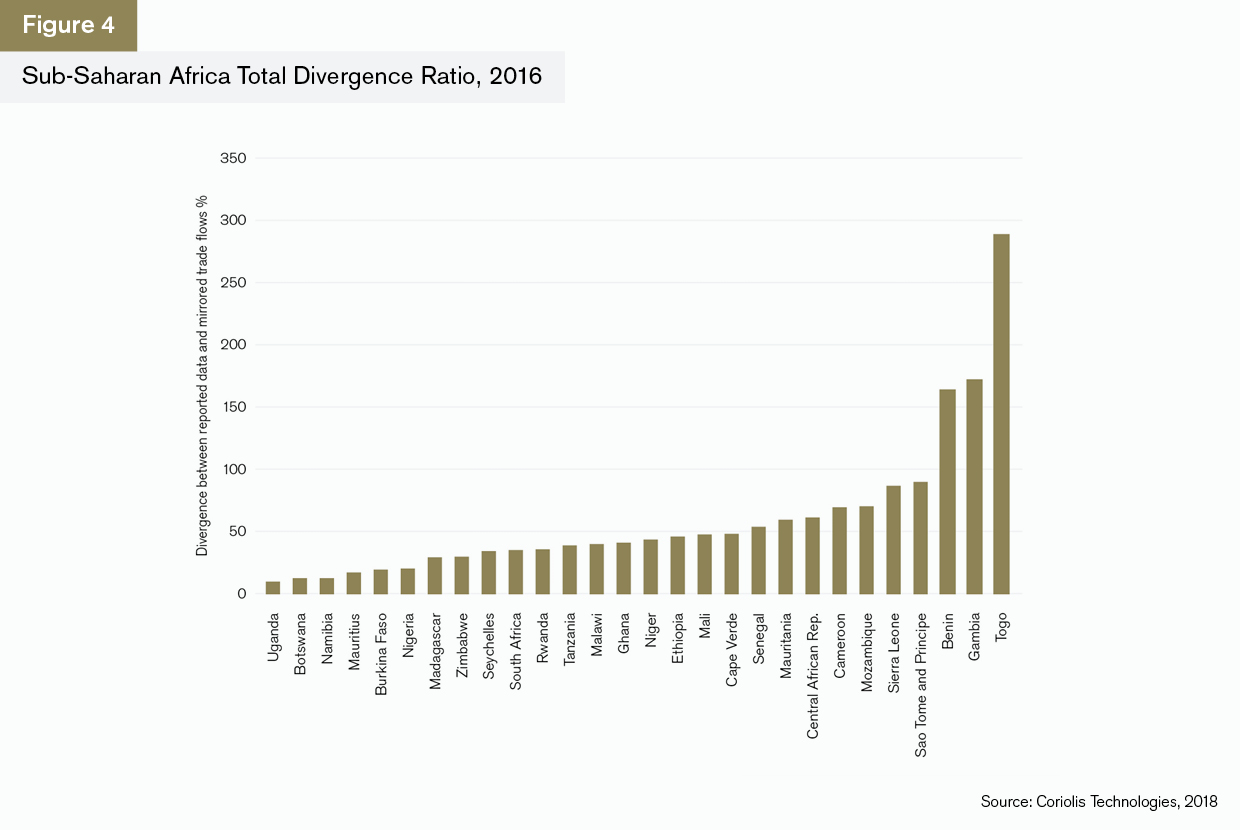
The divergence between reported and actual trade flows in Figure 4 is a ratio weighted for the balance of imports and exports in total trade for each country.
Only Botswana and Uganda are below the world average divergence of 11.5%.
The divergence is a concern because it adds to the perception of risk in the region. On one level, the technique shows how much more trade there is in the region than is usually reported. The fact that it is not reported may indicate divergence from sanctions regimes, tariff and tax avoidance or financial fraud and money laundering.
In the case of Sub-Saharan Africa, the poor reporting is systemic and consistent. This means that it is more likely to be poor governance than poor reporting: if it were deliberate, we could expect more volatility in the differences between what Coriolis’ data picks up and the values a country reports, which is not the case. Nevertheless, the fact that there are big gaps in publicly available data makes compliance when doing business with the countries more difficult in terms of KYC and AML.
This lack of transparency may help to explain why bank-intermediated trade finance (including working capital loans and letters of credit) suffered a major decline in 20141 (Figure 5).

Although there has been some recovery in both import and export trade finance in the region, 2017 appears to have been a weaker year overall, particularly for the financing of exports, which is unlikely to return to the levels between 2011 and 2013. (See Methodology page for Coriolis’ approach to estimating trade finance.)
Trade overview
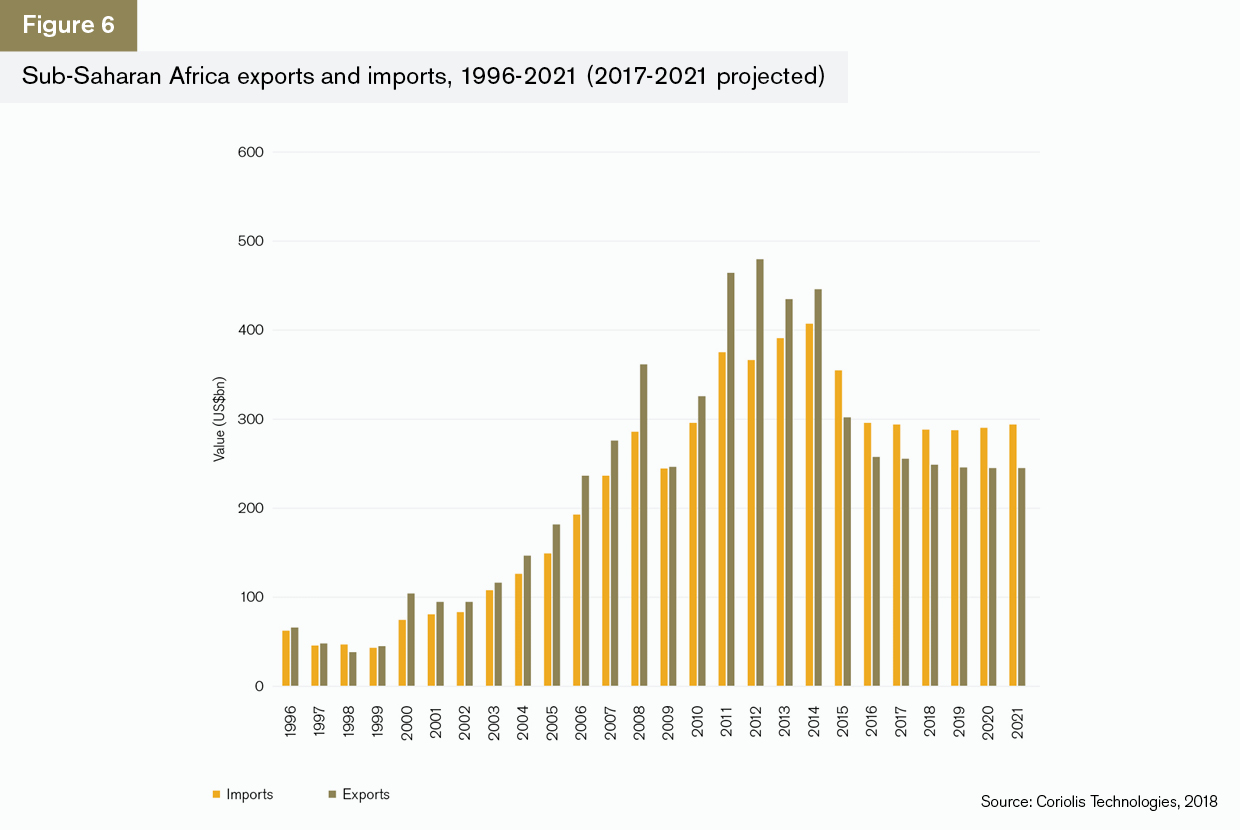
At a country level in volume terms, there is evidence of strong import and export growth over the last year. However, in value terms, trade does appear to have been severely affected by the drop in commodity prices. As such, projections for the next four years show growth in imports but not in exports.
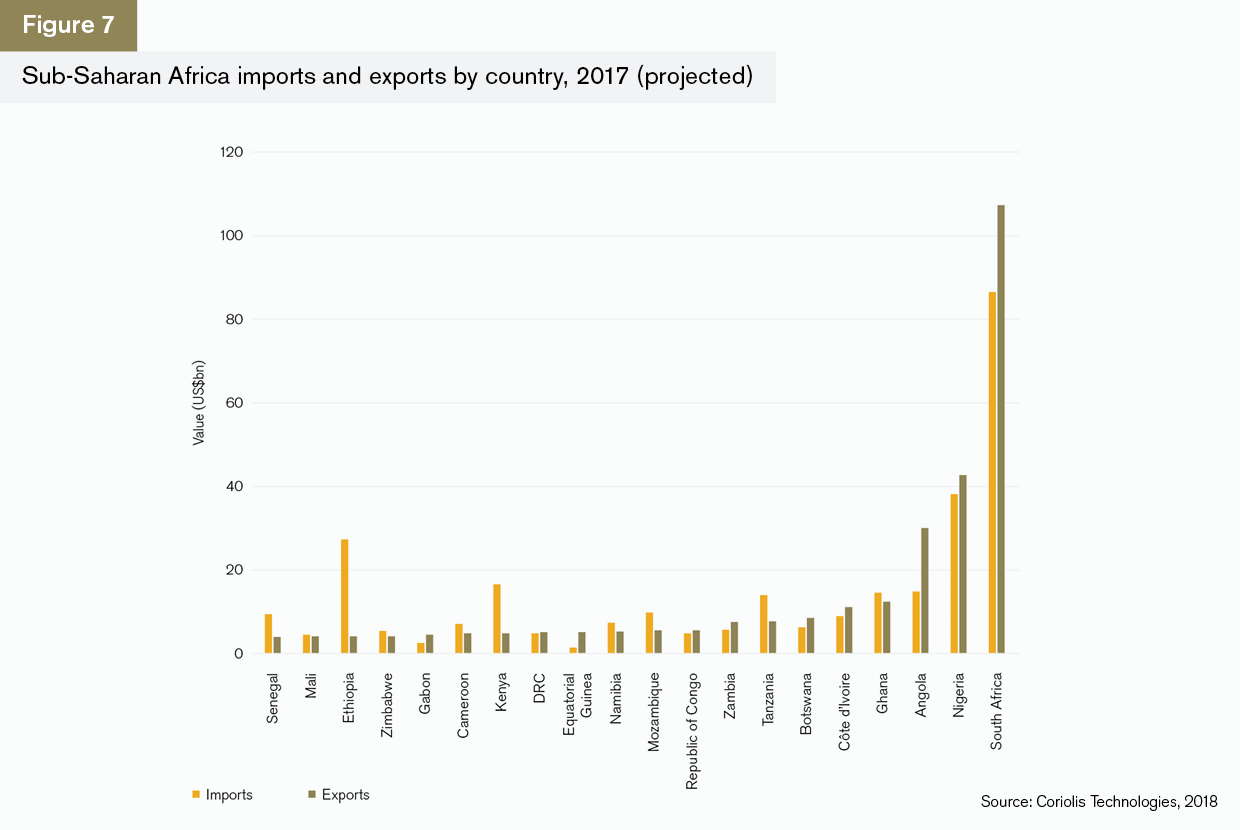
The region’s trade growth is reliant on its biggest trading nations, in particular South Africa, Nigeria and Angola. All of these countries have trade surpluses (Figure 7). South Africa’s exports (US$107bn), dominated by commodities and automotives, are more than twice the size of Nigeria’s (US$43bn). In turn, Nigeria’s exports are nearly a third higher than those of Angola (US$30bn). If, as has been the case, the price of commodities drops, these three economies will be severely affected and this will dampen trade in the rest of the region.
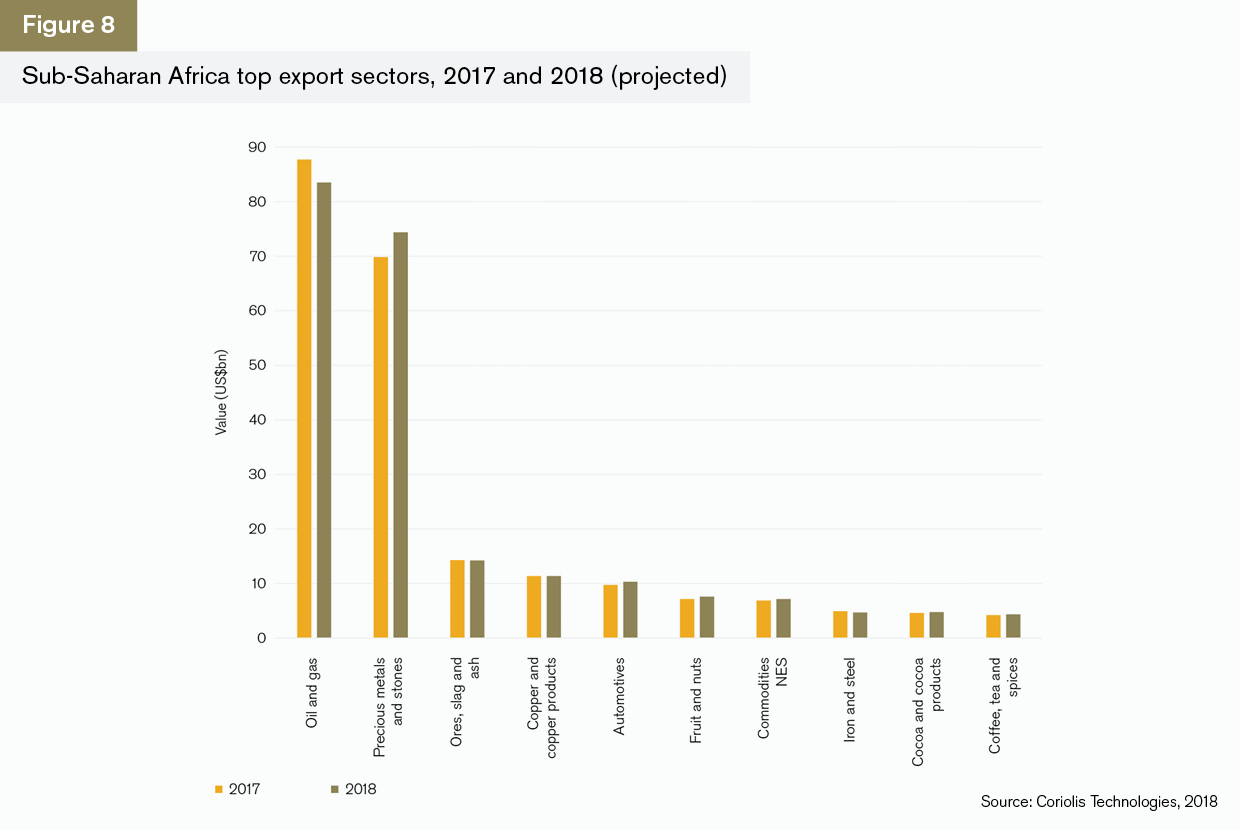
The dominance of commodities in the region’s trade profile is clear. Oil and gas and precious metals and stones (in essence, gold and diamonds) dwarf other sectors (Figure 8). Of the top export sectors, only one, automotives, is not a commodity, and the region’s car trade market is dominated by South Africa. Oil and gas export values are projected to fall back slightly, but there is an upside to this projection as oil prices have started to rise again. The increase in precious metals trade may reflect the rise in gold prices as investors look for safe havens to insure against geopolitical uncertainties, such as any impact of a trade war or conflict in the Middle East.
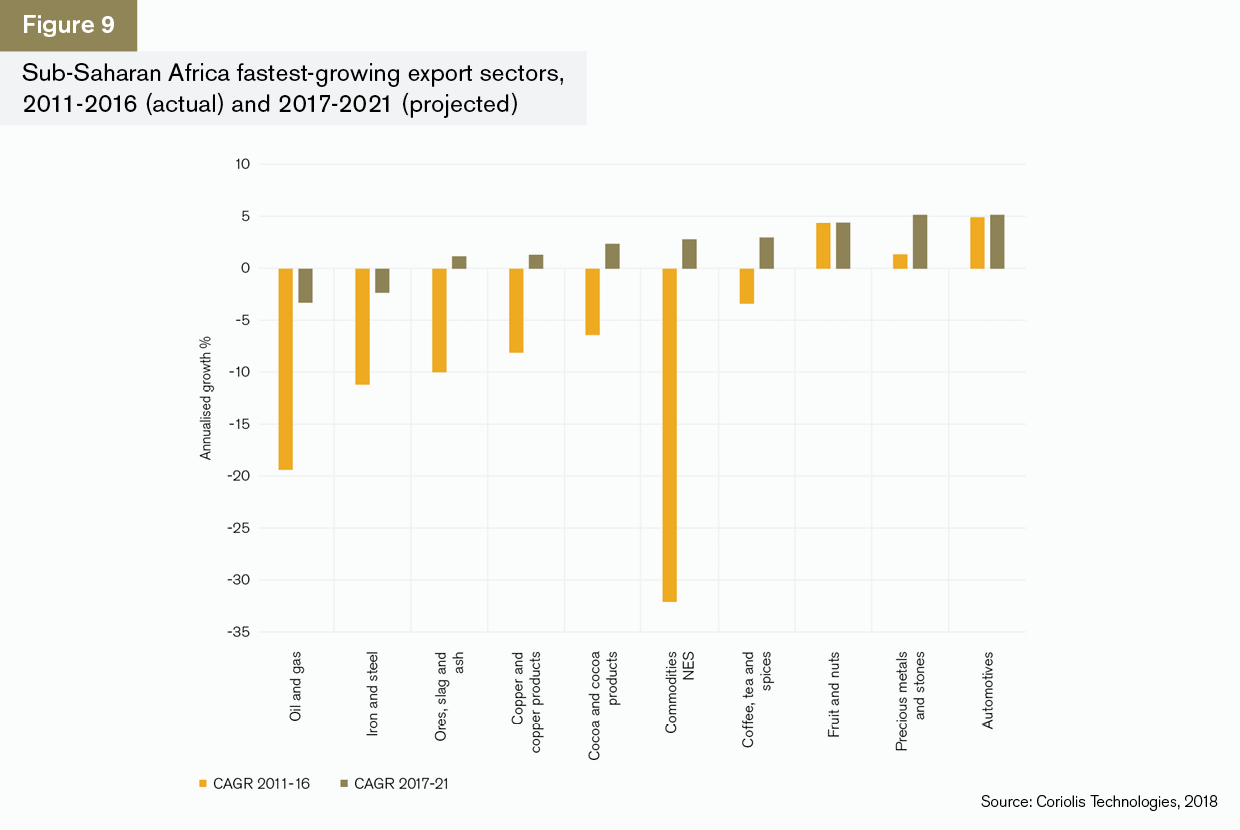
A slightly different conclusion can be reached by looking at the projected rates of growth (Figure 9).
Raw commodities, such as oil and gas, iron and steel, copper and cocoa, have all fallen back over the past five years, reflecting weaker prices and the slowdown in Asian growth and demand. All except oil and gas and iron and steel are expected to return to growth in the next five years. Fruit and nuts, precious metals and stones and automotives have grown over the past five years, and while these are smaller sectors, the growth in automotives exports is particularly positive because it will help to reduce the reliance of the region on commodities.
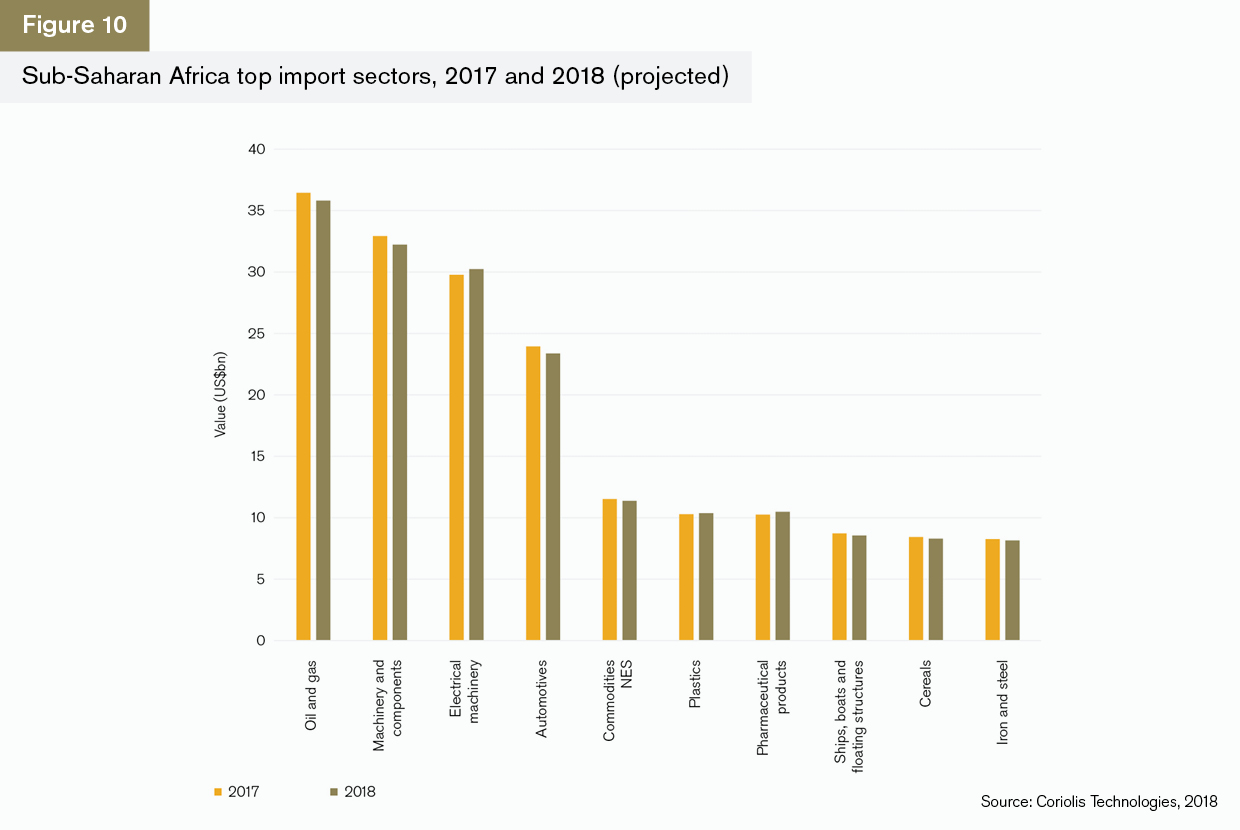
Oil and gas continues to dominate the region’s import profile as well, although machinery and components and electrical machinery are strong sectors. These are infrastructure-related sectors and in 2017 were worth some US$33bn and US$29bn respectively. The value of machinery and components is expected to fall slightly in 2018 but the general picture for the top sector imports is that they will all remain at similar levels in 2018 compared to 2017.
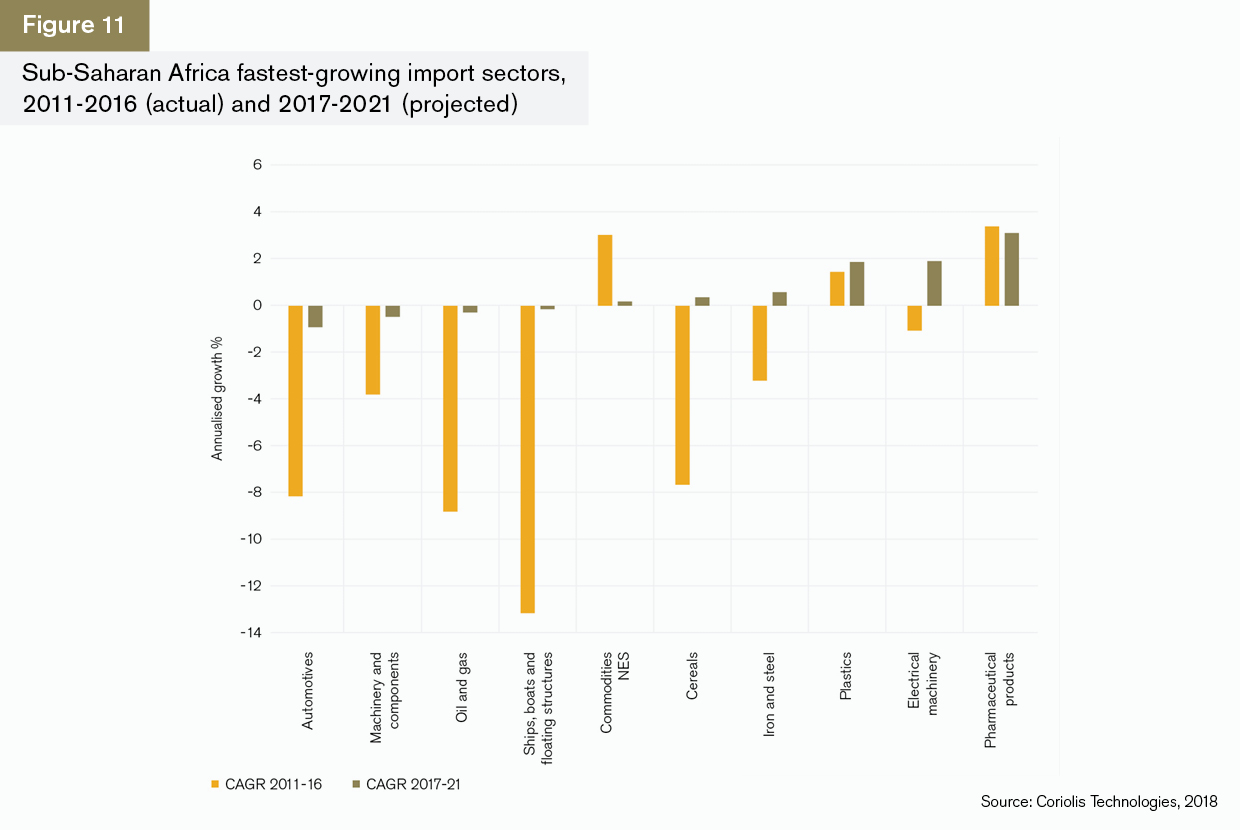
The fastest-growing import sectors present a different perspective on how trade may change over time (Figure 11). Automotive and machinery component imports declined from 2011 to 2016, as did imports of oil and gas, ships, cereals, iron and steel and electrical machinery. This may reflect increased self-sufficiency or more intra-regional trade, but it also reflects the economic difficulties that the region has experienced since the collapse of commodity prices. Growth in pharmaceuticals and electrical machinery is set to increase over the next five years suggesting a greater demand for higher end products.
While oil does dominate the region’s exports, the correlation between the region’s trade and the oil price is 73% (Figure 12), which is lower than in the Middle East and North Africa, where the figure is more than 90%. Trade fell back after the collapse of oil prices; however, the drop was not severe.
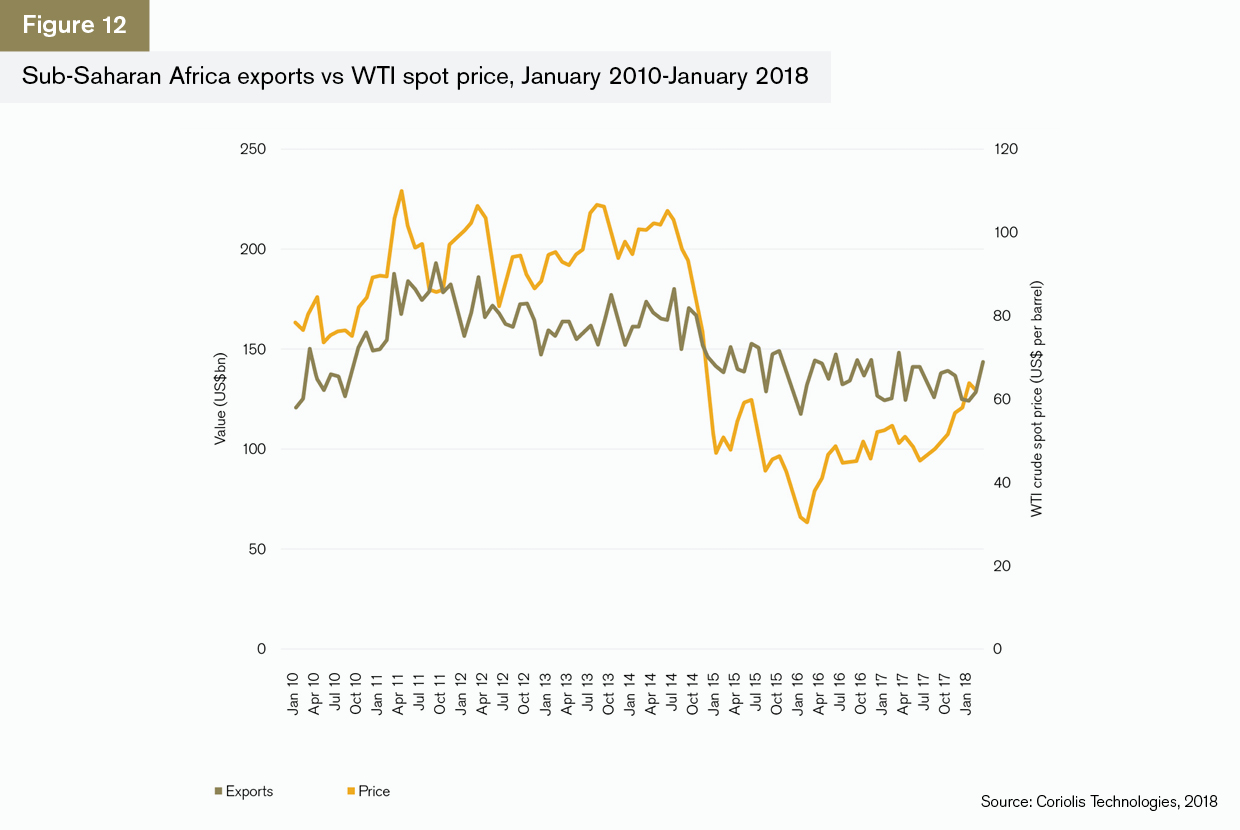
Since Q4 2017 there has been an uptick in trade in Sub-Saharan Africa, which is similar to the trends reported elsewhere in the world. It may be that this is a result of higher prices of other commodities, particularly gold, but it may also be an early indication that the region’s trade is less dependent on oil prices and therefore has scope to diversify.
Looking closer at Sub-Saharan Africa’s trading partners (Figure 13), China’s influence in the region cannot be understated. Exports to China were worth US$46bn in 2017 and look set to increase to nearly US$49bn in 2018. In turn, China has continued to invest heavily in Africa: foreign direct investment (FDI) totalled nearly US$70bn between 2005 and 2017 and spanned a number of sectors including minerals, commodities and manufacturing.

China is the region’s largest export partner. The fact that exports to China are more than twice that of the second-largest export partner, India, is a reflection of the importance of the region’s raw materials and their usefulness to China’s own economic development and of the relationships that China has fostered with the region to replace the trade and investment gap left by the US, in particular.
What’s also interesting is the rate of growth in the top 10 export partners since 2011 (Figure 14).
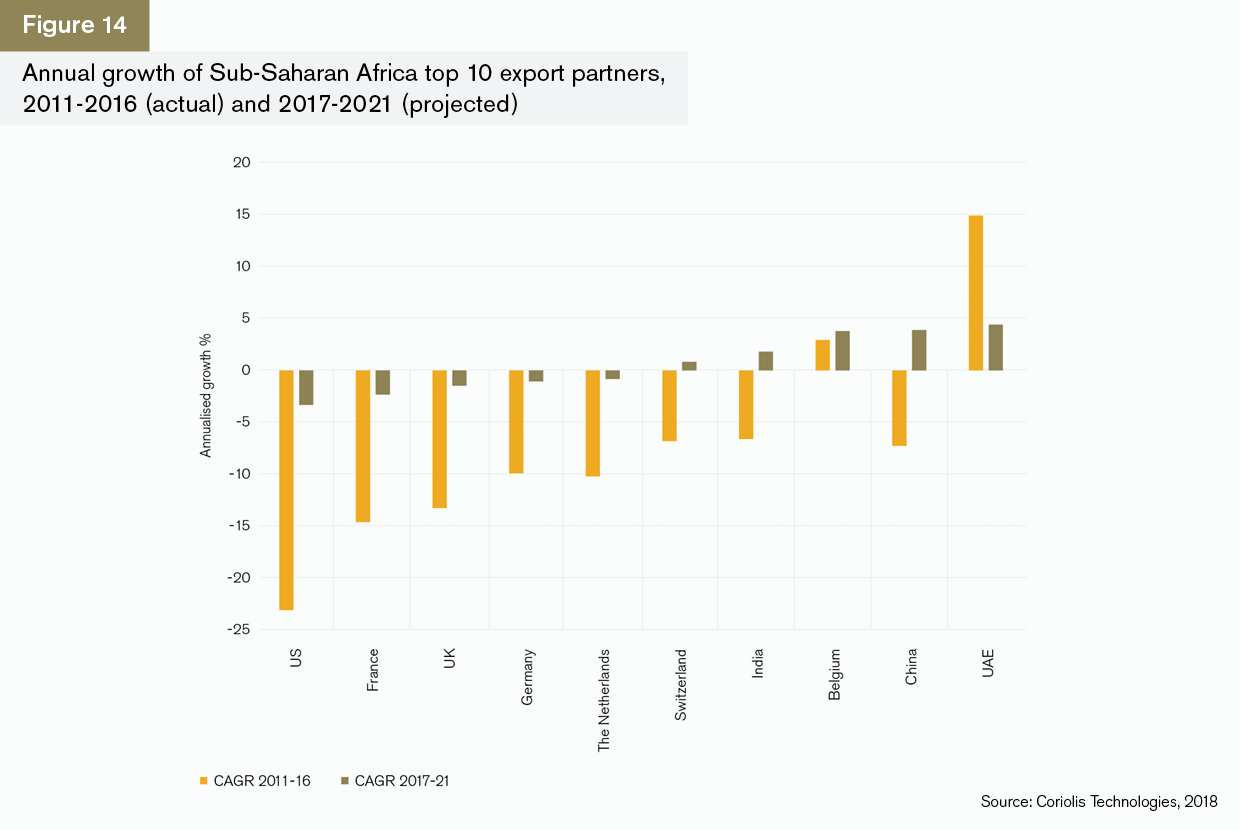
The UAE and Belgium are the region’s fourth and eighth-largest export partners, and annual growth has been consistent since 2011. In contrast, growth in exports to China (by value) fell back between 2011 and 2016 – arguably because of the drop in oil prices. Belgium and the UAE import precious metals and stones from Sub-Saharan Africa: these prices did not experience the dramatic collapse of commodities such as oil and gas, copper and iron ores.
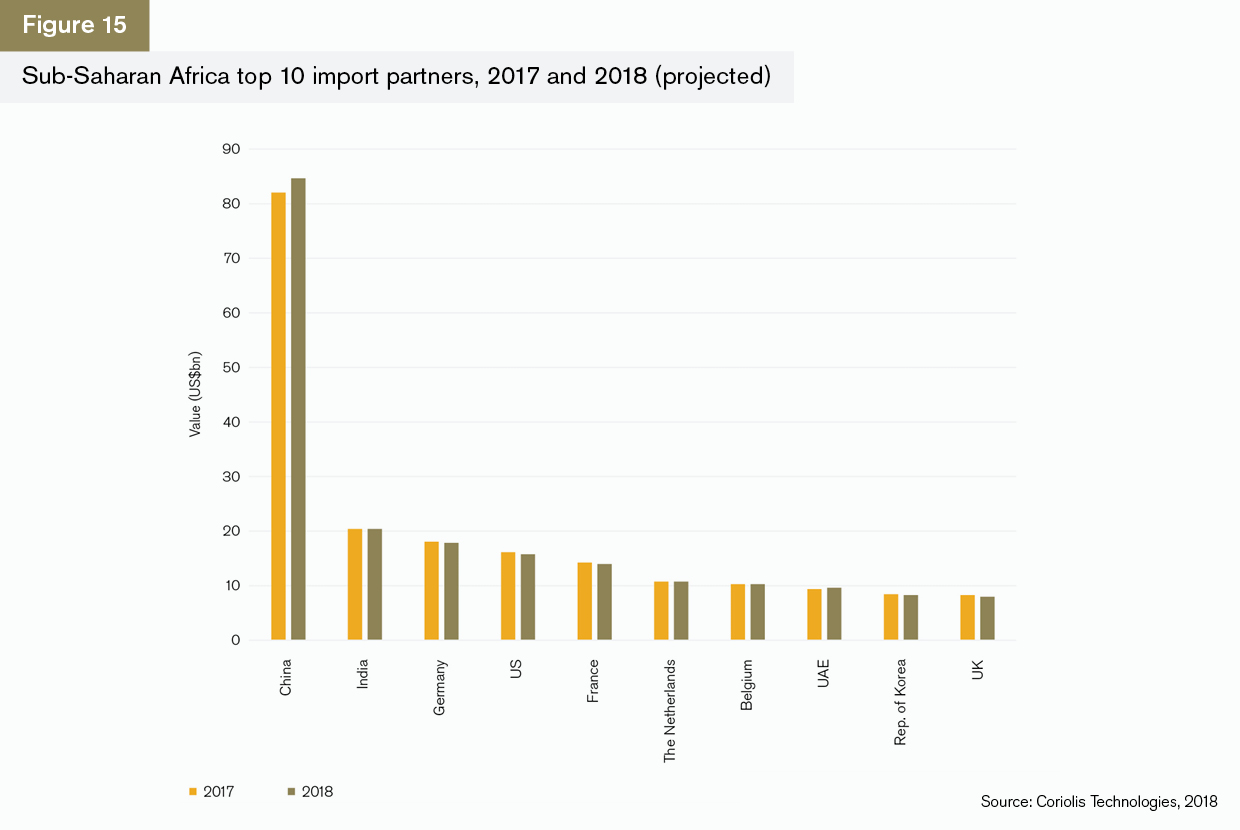
China is the region’s largest import partner (Figure 15). The country provides substantial infrastructure-related investment and Sub-Saharan Africa imports nearly US$85bn-worth of goods annually from China, with the largest sectors being electrical machinery. By 2018, China is expected to import almost as much as India, Germany, the US, France, the Netherlands and Belgium combined.
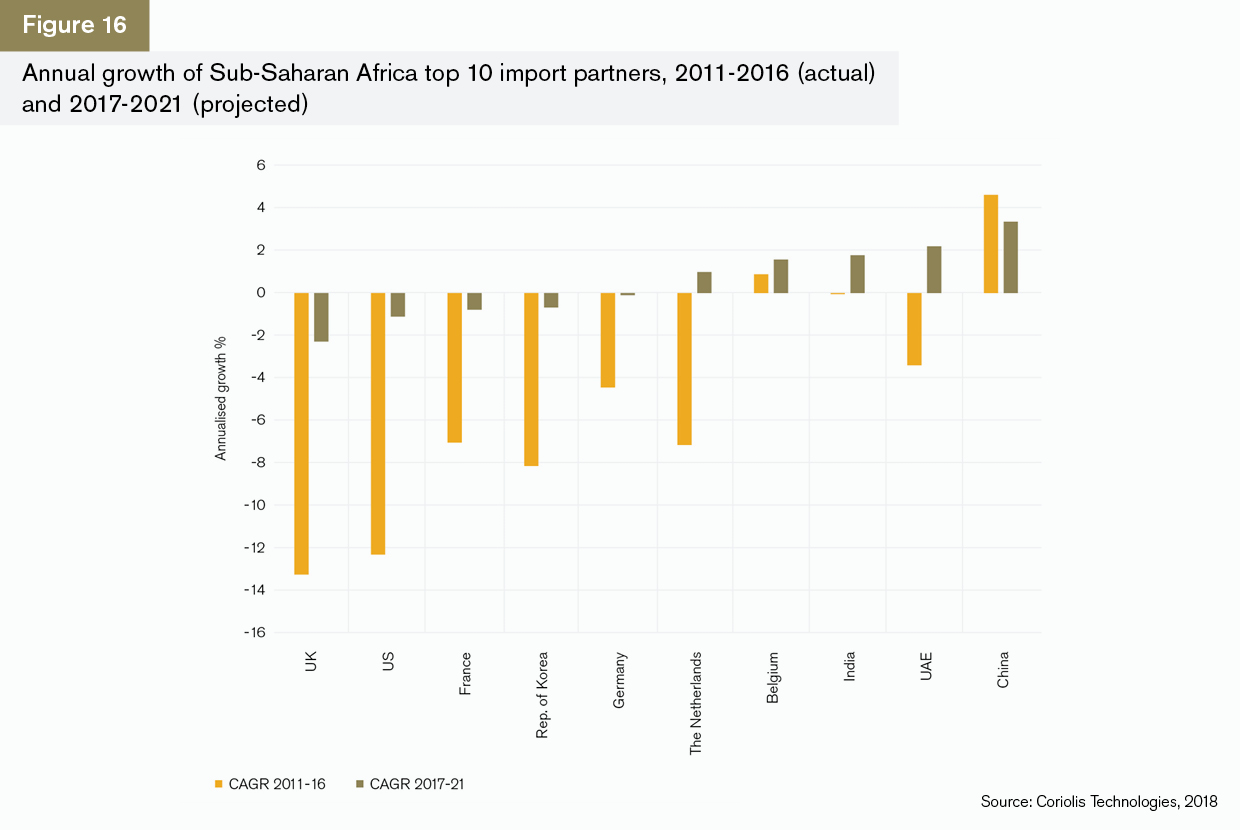
China is also the import partner that is likely to grow the quickest over the next five years, at an annual rate of 3.4% (Figure 16). Rates of growth are also high for the UAE, India, Belgium and the Netherlands. These three countries all have large ports which may act as distribution hubs.
All of the growth countries are important partners in precious metals and stones, as well as oil and gas.
In-depth overview of trading partners and sectors
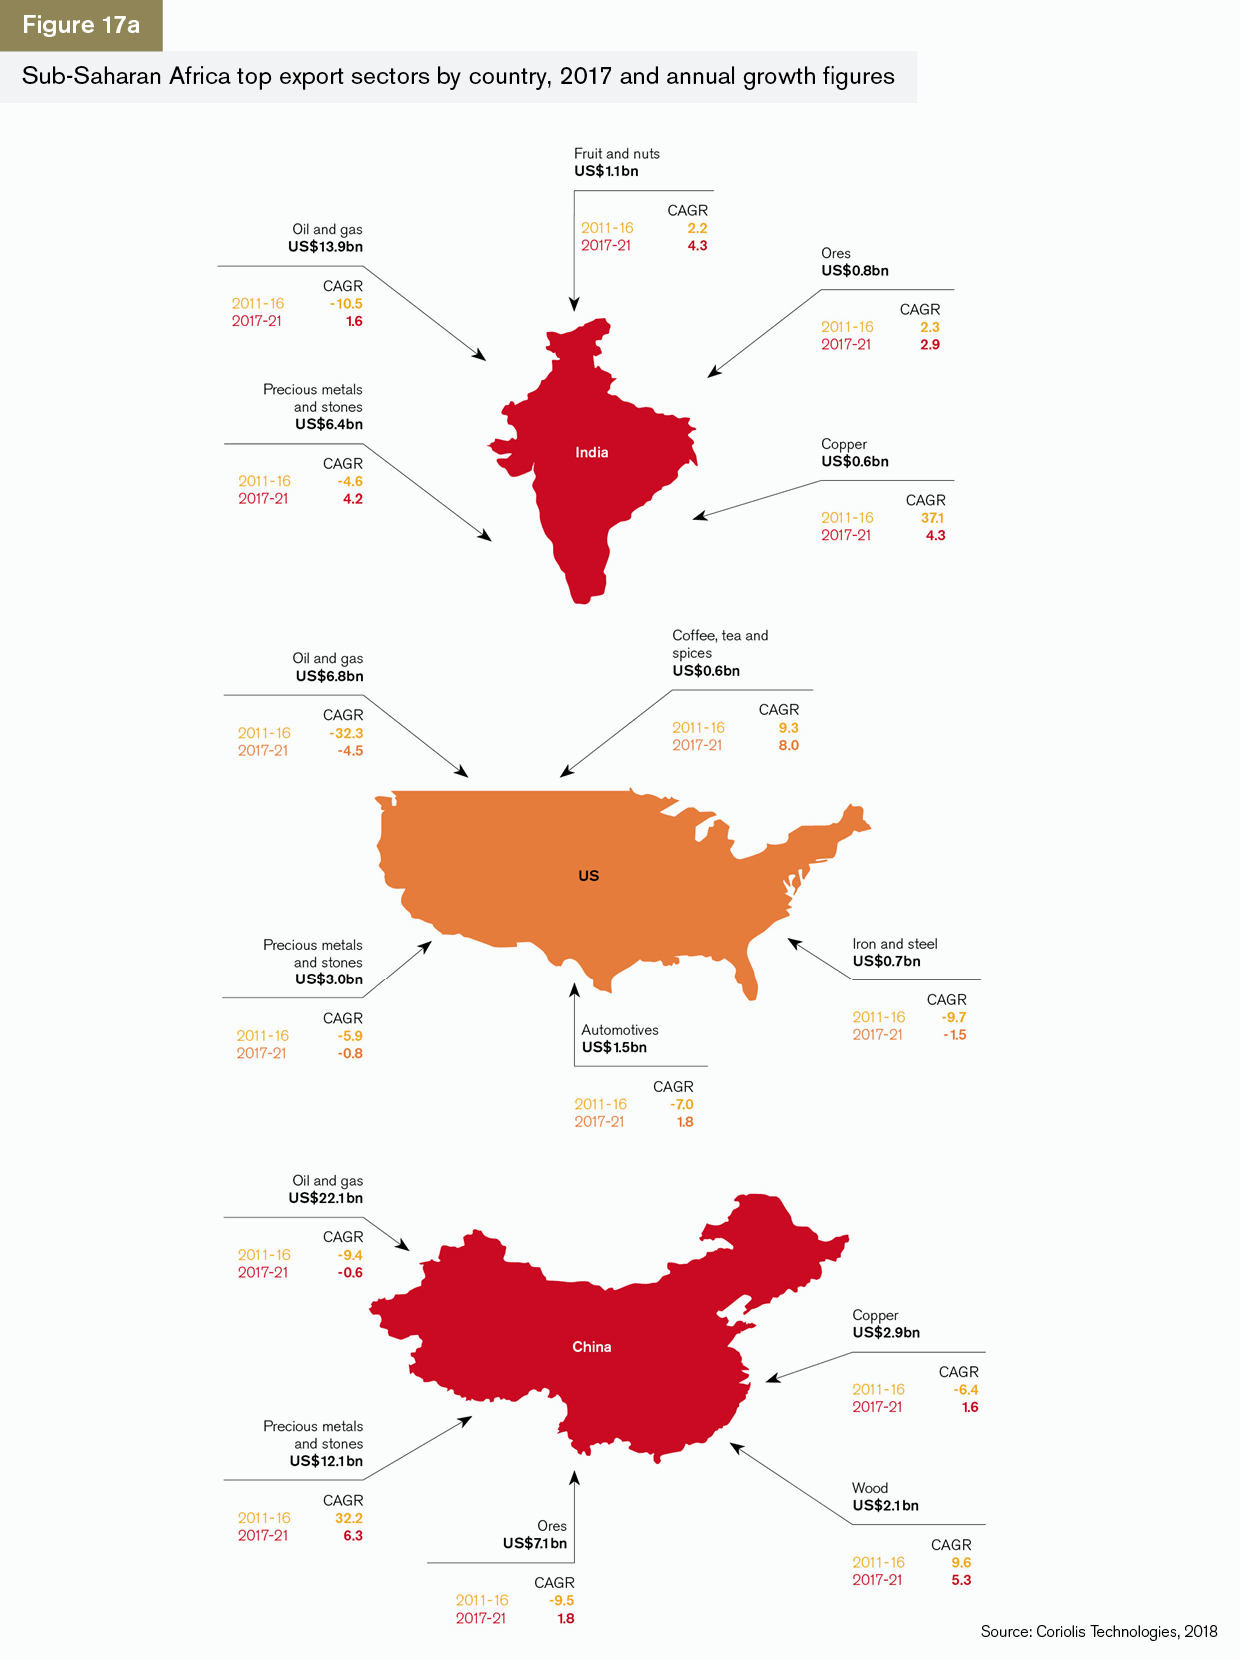
Exports to India
Sub-Saharan Africa exports to India are predominantly oil and gas and precious metals and stones. India, like China, is a large consumer of gold and diamonds but these are largely for ceremonial purposes and thus the values are significantly lower than for oil. The growth rates reflect the growing importance of India as a trading partner: both the smaller sectors, including fruit and nuts and copper, as well as big sectors like precious metals are set to grow at faster rates.
Exports to the US
Exports to the US are much lower than to either India or China and have fallen back in every sector except coffee and tea over the past five years. The two areas where growth is expected are automotives and coffee and tea. The US’ trade in the latter is relatively small, while automotives account for nearly US$1.5bn of trade in 2017. This is positive, but largely focused on trade with South Africa and therefore unlikely to ensure that the region recovers its growth as a whole.
Exports to China
Sub-Saharan Africa’s exports to China will continue to reflect China’s interest in the natural resources of the region. Trade in precious metals and stones has grown exponentially since the financial crisis and is expected to continue to grow at an annualised rate of above 6% to 2021. China’s demand for large quantities of precious metals may reflect its strategy to create a strong currency that can be priced independently of the dollar.
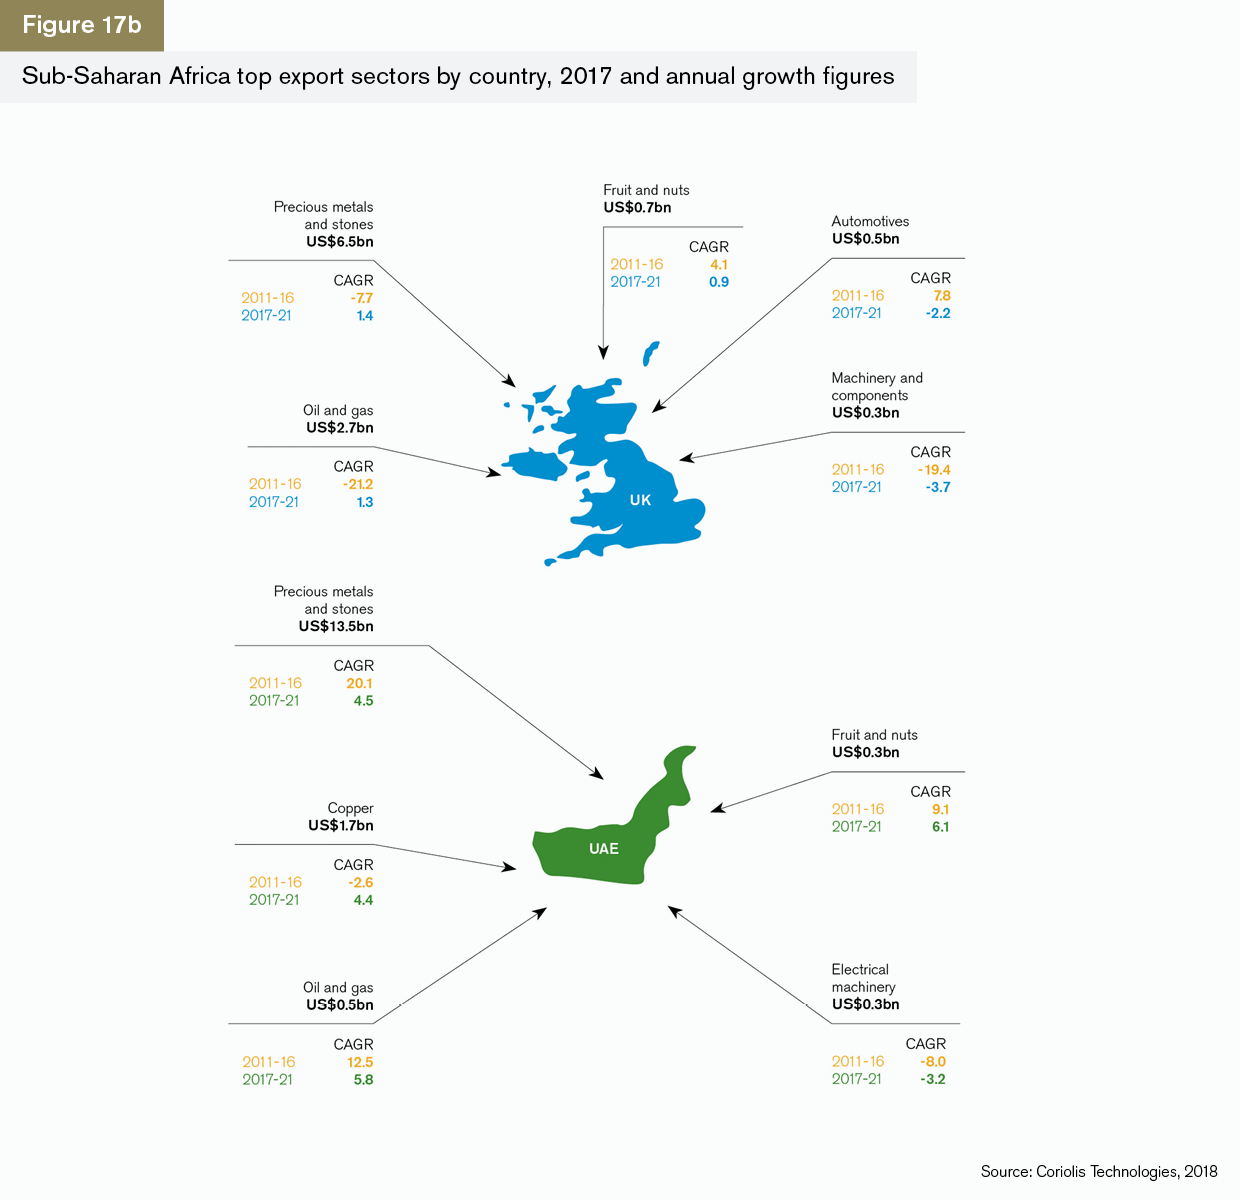
Exports to the UK
Exports from Sub-Saharan Africa to the UK are dominated by precious metals and oil and gas, but these have fallen back significantly over the past five years. Rates of growth are expected to improve but only at a modest rate (1.4% and 1.3% respectively). Fruit and nuts and automotives grew quickly over the past five years but are expected to grow only modestly in the case of fruit and nuts (0.9%) and negatively in the case of automotives (-3.7%). The National Association of Automobile Manufacturers of South Africa expects exports to the EU and UK to decline as a result of Brexit and the implementation of tariffs2.
Exports to UAE
The UAE bought some US$13.5bn of precious metals and stones from Sub-Saharan Africa in 2017. The growth in this sector is substantial and is set to remain at above 4% for the next five years. Because the UAE is also a port, it acts as a means of transporting other products from the region to the rest of the world. Fruit and nuts and oil and gas are the strongest sectors with growth rates of 6.1% and 5.8% respectively.
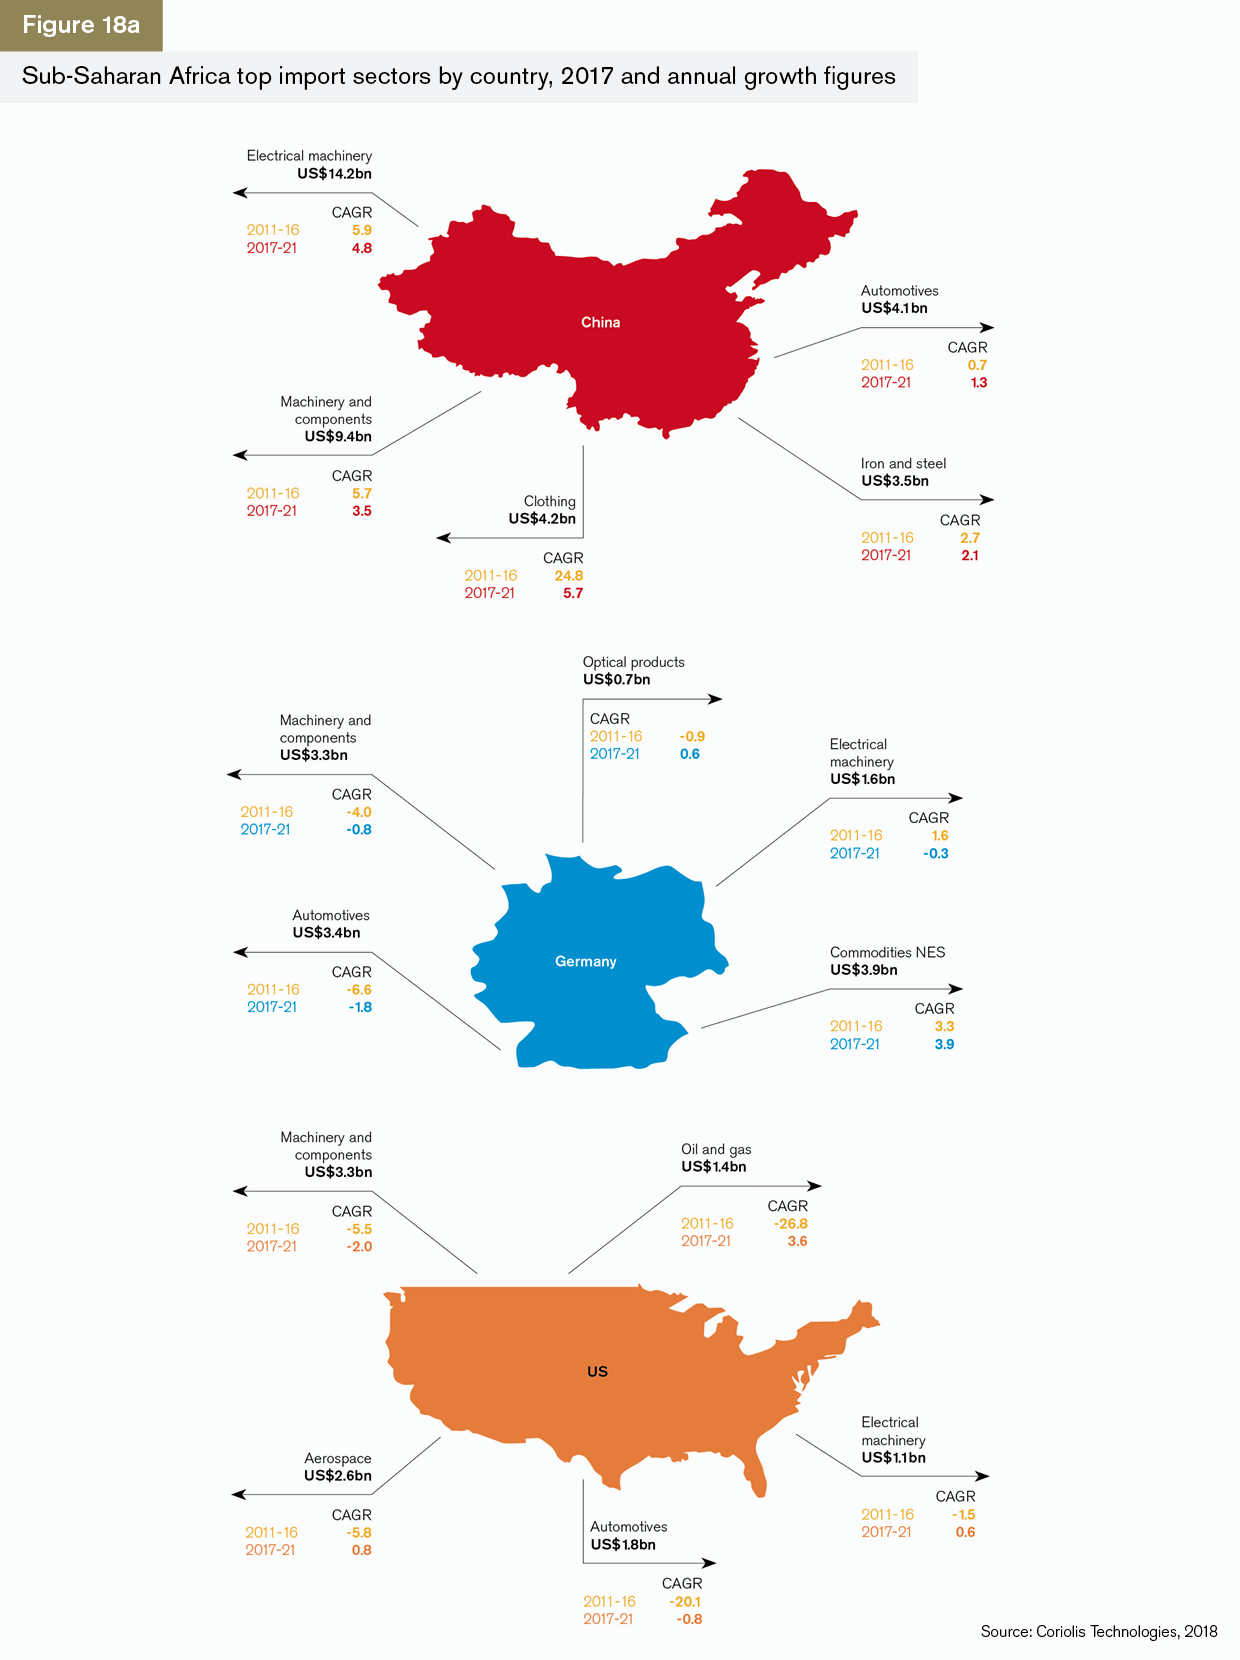
Imports from China
China is Sub-Saharan Africa’s largest import partner by some margin, with a particular focus on infrastructure products such as electrical machinery and machinery and components. Electrical machinery is particularly important because the region is moving quickly to adopt electronic, phone-based communications. This is evident in the annualised growth rates in the sector of nearly 6% over the past five years and nearly 5% each year to 2021. A subsector of this is telephone equipment, which has grown by 7% annually to 2016 and is projected to grow at a similar rate to 2021. The region’s imports of clothing from China have grown exponentially since 2011 and are set to grow by nearly 6% annually to 2021.
Imports from Germany
Sub-Saharan Africa’s imports from Germany have grown in two areas over the past five years: commodities not elsewhere specified (NES), which is a generic catch-all term for unclassified goods, and electrical machinery. Commodities NES is the only sector that is set to grow over the next five years. Because this is a sector closely correlated with sanctions avoidance and arms, this is an area that clearly needs more transparency.
Imports from the US
Sub-Saharan Africa’s imports from the US have fallen back sharply since 2011, with regulatory costs unintentionally diverting US banks away from Africa. This behaviour continued despite initiatives brought in by President Barack Obama at the end of 2016 to increase US trade with the region. Oil and gas imports look set to grow by 3.6% annually to 2021, but these are relatively small and are unlikely to reach the levels that had been attained before the collapse in oil prices. Imports from the US overall are unlikely to recover to their pre-2014 levels.
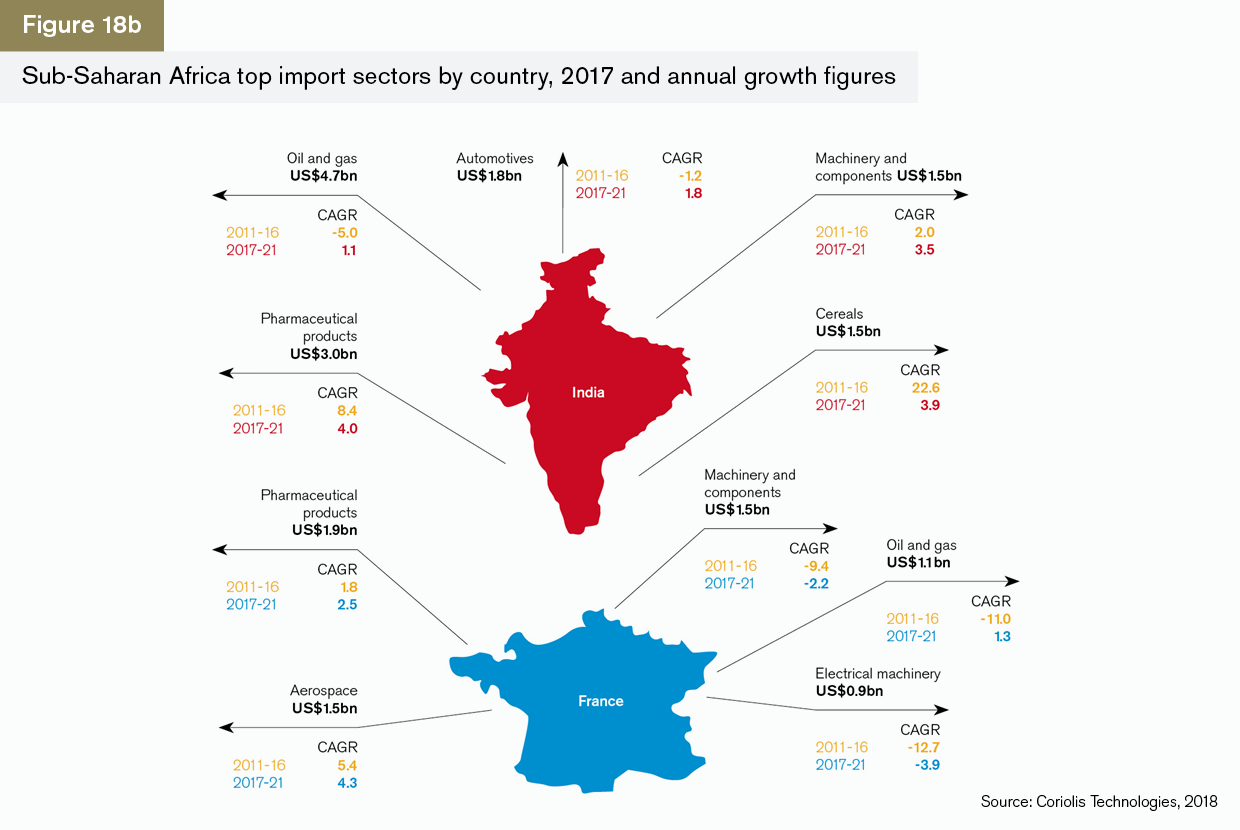
Imports from India
Sub-Saharan Africa’s second-largest import sector from India is pharmaceuticals. Imports have grown at a rate of 8.4% annually since 2011 and are set to grow the fastest of any sector to 2021 at 4% a year. India’s generic drugs sector is largely behind this growth, and this reflects both the need for adequate medical supplies and the growth in cheap over-the-counter generic medicines.
Imports from France
Sub-Saharan Africa imports roughly one quarter of the value of pharmaceuticals from France as it does from India, arguably reflecting the higher prices of French pharmaceuticals. However, the sector is set to grow by 2.5% annually to 2021. France has strong historical relations with the region but nevertheless its trade has fallen back over the past five years, and in machinery and components and electrical machinery, imports are set to continue to fall by -2.2% and -3.9% respectively.
China’s influence over African infrastructure
Views on the impact of China’s BRI are mixed, with some commentators regarding it as a positive development that will help Africa to build its infrastructure. Others see it as a strain on Africa’s resources if the investments are not strategic.
China is increasing its exports in the communications sector (Figure 19). Exports to Sub-Saharan Africa of telephone equipment, which includes digital and WiFi telephony, were US$12bn in 2017 and are projected to grow to just over US$13bn in 2018. Similar growth is expected in computing equipment.

Country analysis
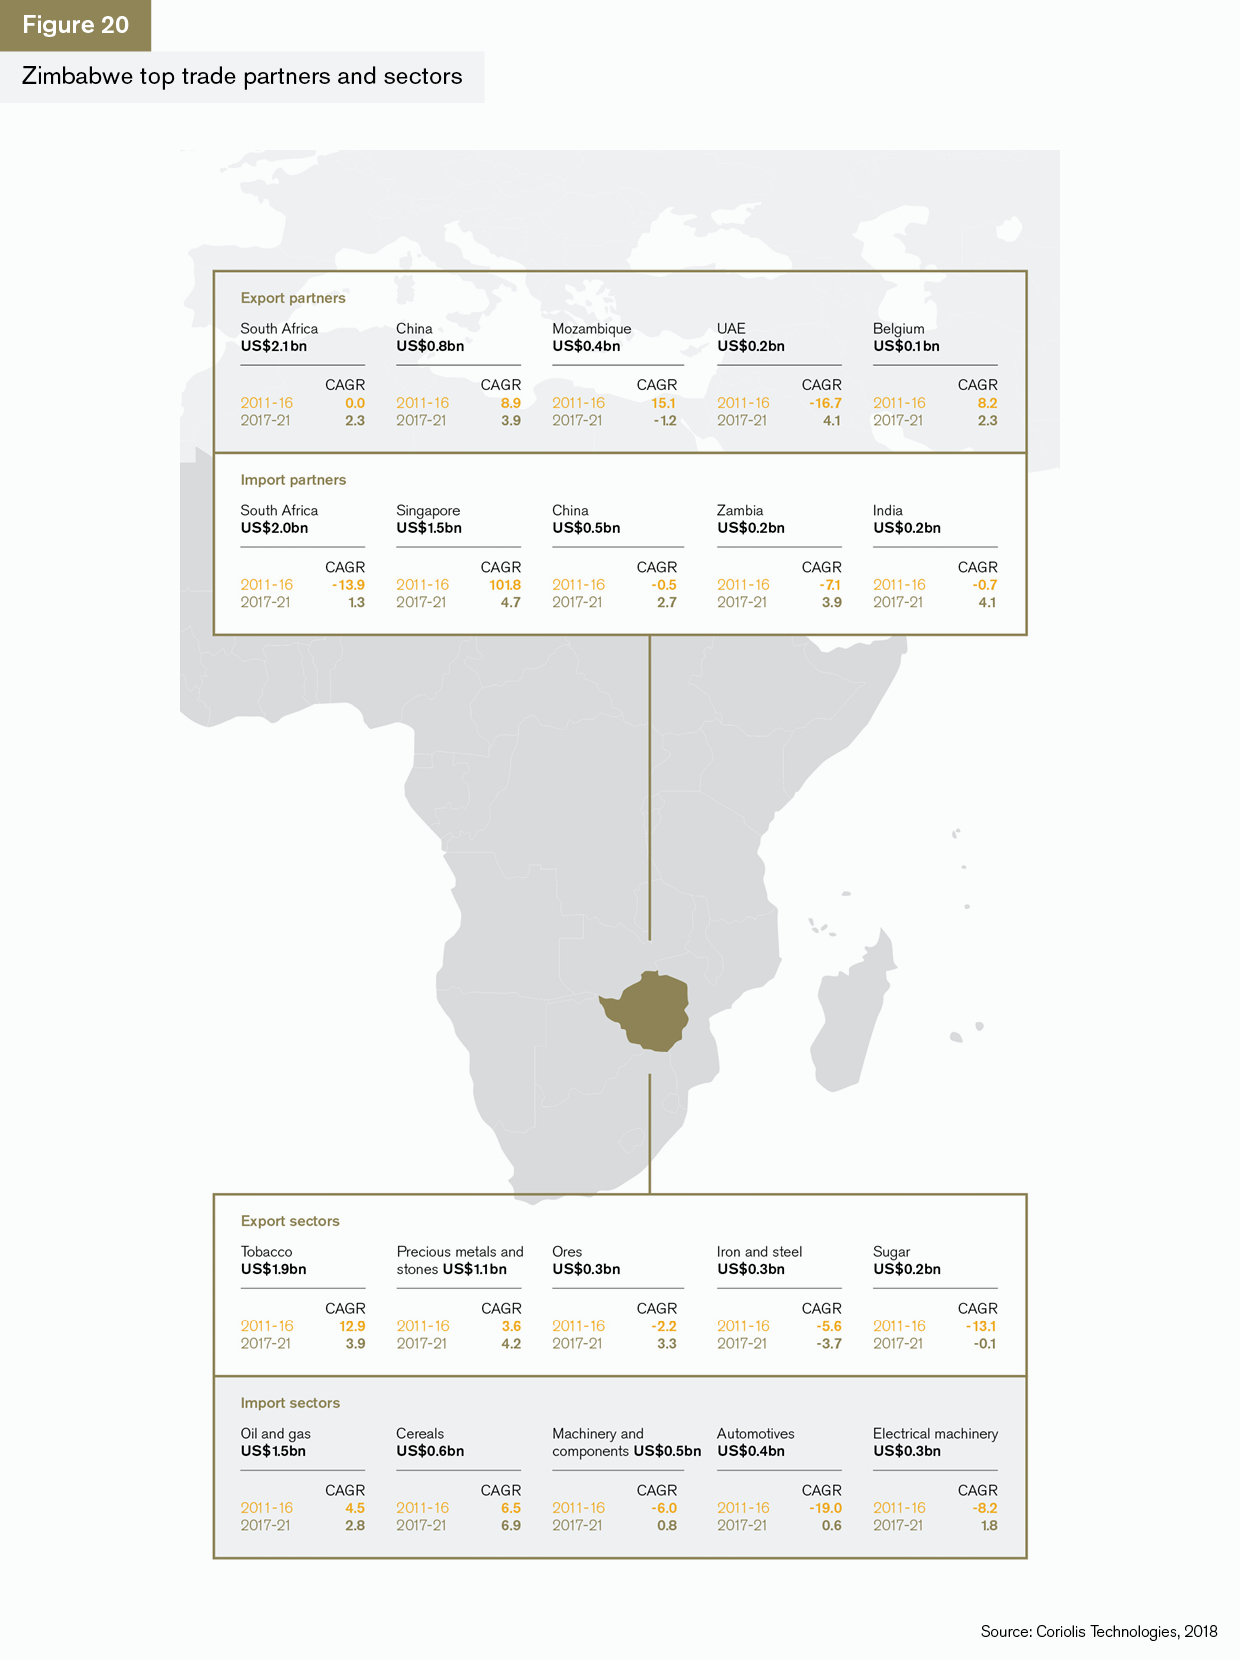
Zimbabwe
The challenge for President Emmerson Mnangagwa is to ensure that Zimbabwe can return to the international fold in trade and political terms. Much of this will depend on the elections, which are due in July, and the extent to which he is able to convince the Zimbabwean population that the economics of growth and sustainability are central to his policies. The country is resource rich and its trade with South Africa will be the driver of its rehabilitation. Despite years of relative isolation, its export partners are not all regional ones. China, Belgium and the UAE are also important. Growth is expected in tobacco exports, although this is unlikely to be as rapid as it has been in the past, given the reduction in appetite for cigarettes in the developed world.
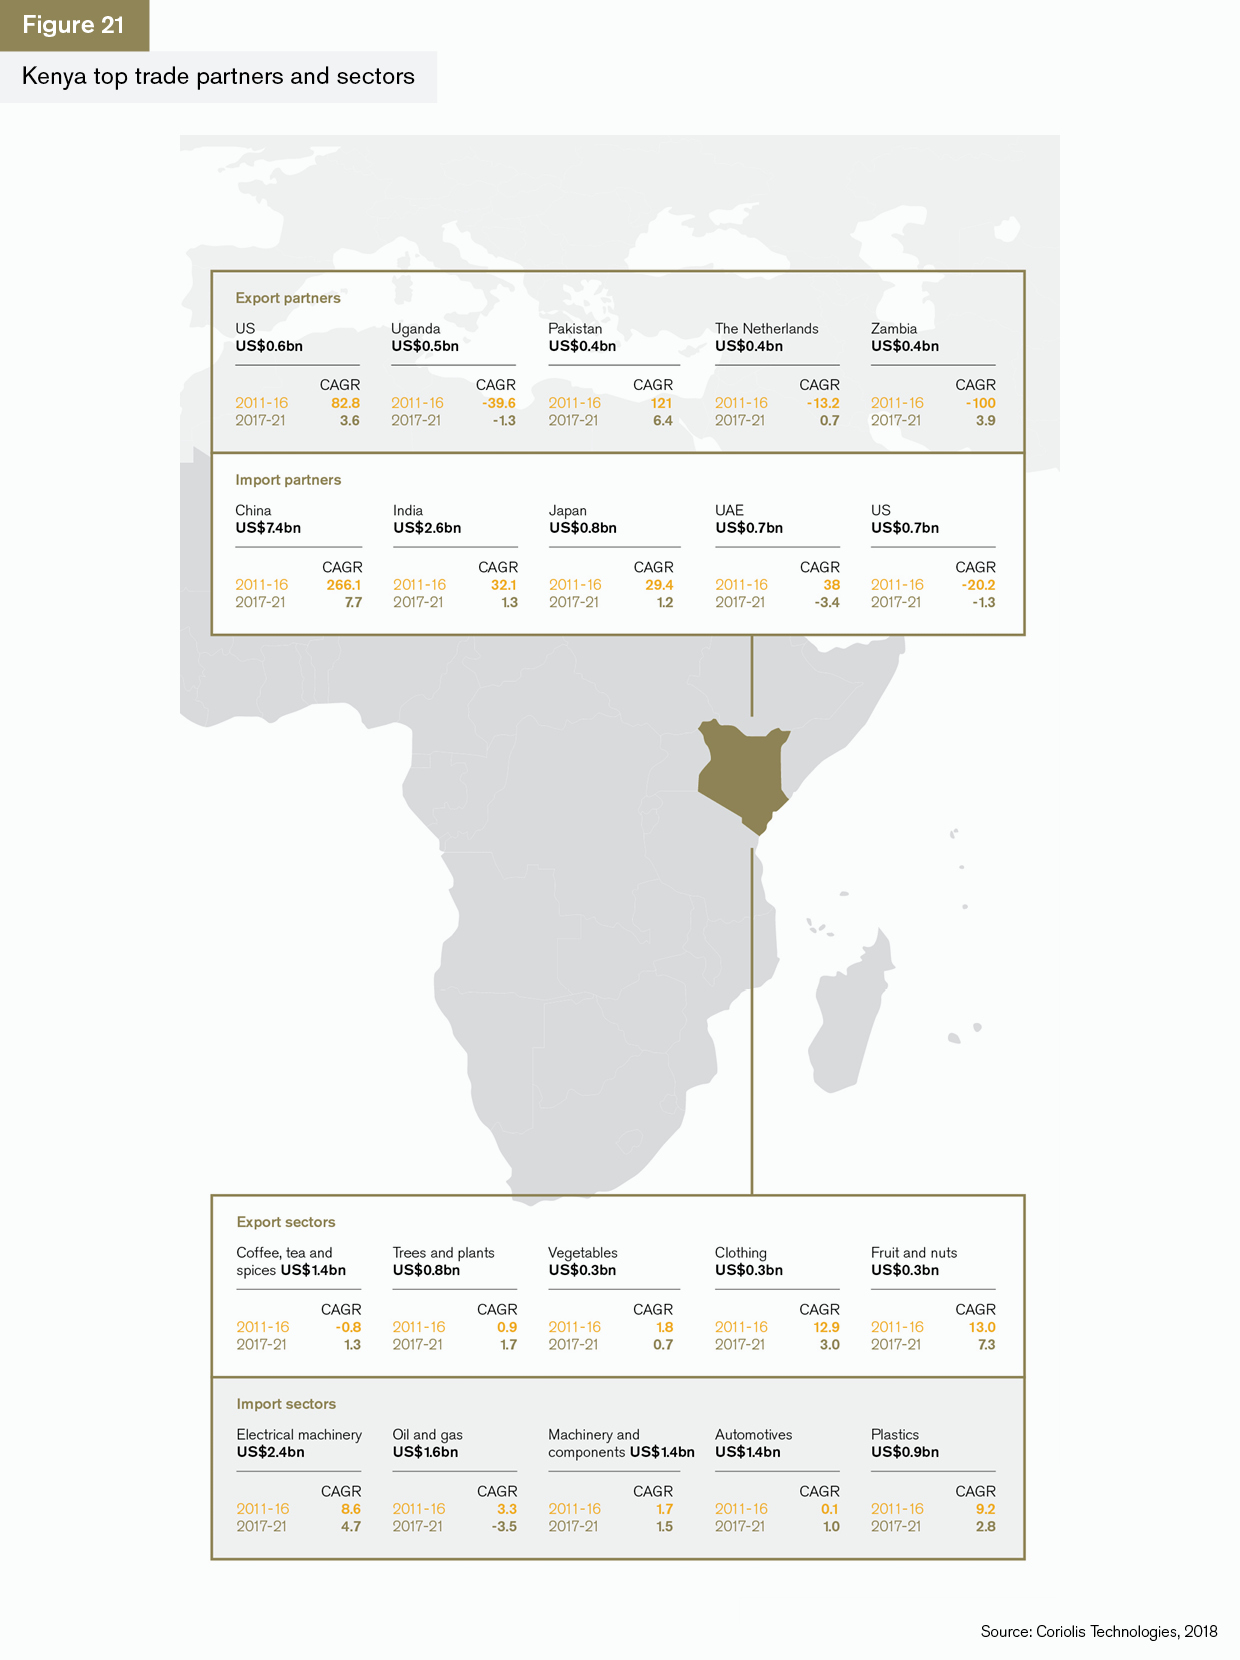
Kenya
Kenya’s economic growth is affected by its political stability which, at best, tends to be fragile. Kenya’s import and export trade patterns are volatile and patchy – a reflection of the sectors it trades in and the rapid growth it has seen since 2011. The country is one of Africa’s growth engines for technology and entrepreneurship, and this is reflected in its imports of electrical machinery, which are set to grow over the next few years by nearly 5%. Growth in this sector since 2011 is a reflection of dominant telecommunications players such as Safari.
Kenya remains a major exporter of coffee and tea, plants and vegetables. With the notable exception of coffee, these tend to be lower-valued commodities, especially when food prices globally are low, and this affects the extent to which the country can grow its economy through goods exports.
It is one of the few countries in the Sub-Saharan African region that is seeing growth in trade with the US. Exports to the Netherlands are dominated by fruit, vegetables and plant products sent there for auction and onward export.
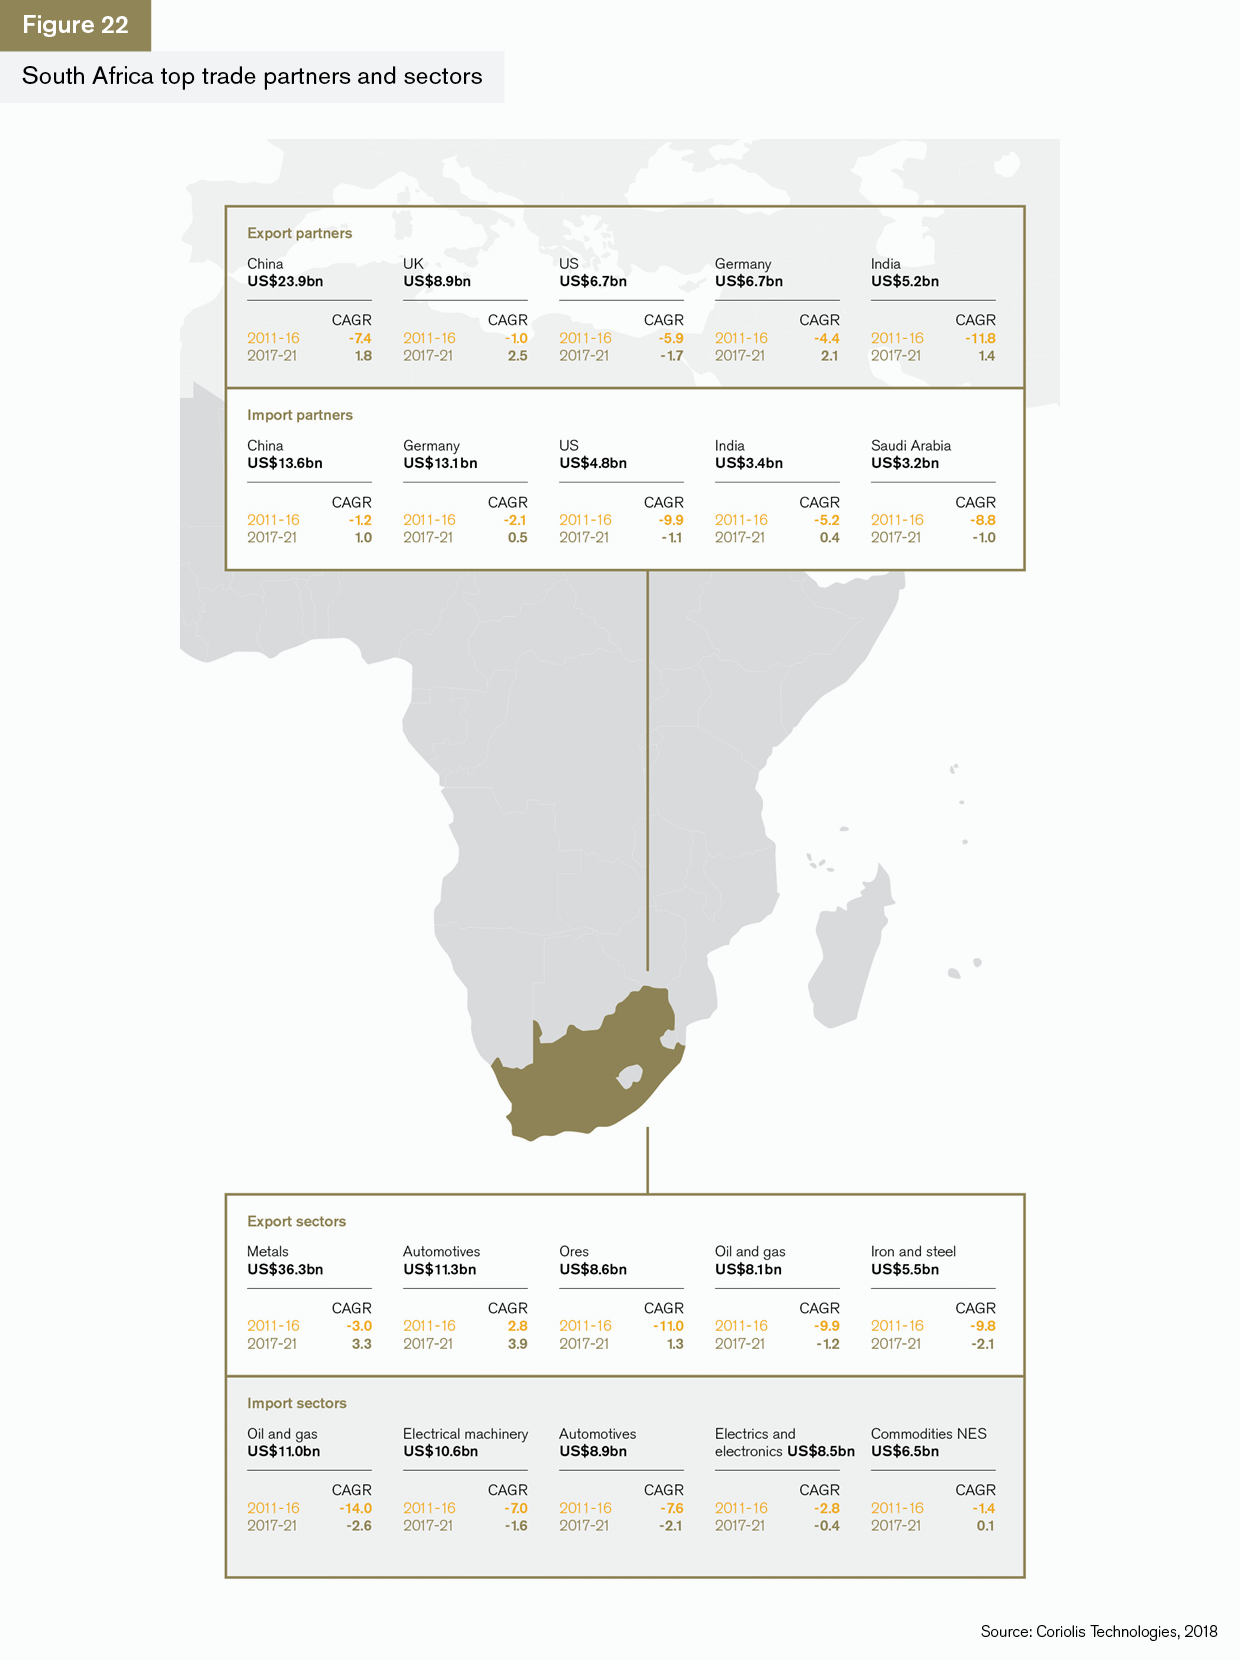
South Africa
South Africa, led by President Cyril Ramaphosa, has an opportunity to establish a coherent foreign policy that builds on its role within the Brics group of countries to create economic advantage. South Africa exports two and a half times as much to China as it does to the UK at US$23bn compared to US$8.9bn. Exports to all of its top five partners are projected to grow over the next five years, and with exports to China projected to grow at an annualised rate of 1.8% from a high base, this will serve to increase the importance of China as a trading hub.
Services trade
Sub-Saharan Africa has developed rapidly in terms of its information and communication technologies (ICT) and this is reflected in its services trade (Figure 23). Although the data is poor for the region, it is clear that both Kenya and South Africa have moderate services sector surpluses. In Kenya this is in the information and communications technologies sector, while South Africa has a strong financial and investment services sector.
Kenya’s surplus is in sharp contrast to its commodity-based and somewhat erratic goods trade. This may offer the region an alternative route to growth.
Nigeria has the largest trade deficit and is by far the largest importer of services, which include telecommunications, wholesale and retail, and real estate, creating a picture of an economy that is becoming less dependent on oil.

Summary and conclusions
The region is recovering well from the collapse of commodity prices in 2014: In addition to this, there is evidence that some non-commodity sectors are growing. The automotive sector in particular is witnessing strong growth and, as South Africa adjusts to a post-Zuma era, the automotive sector is likely to become more important.
China’s role in the region is key: China has undertaken substantial inward investment over the past five years and although the Belt and Road Initiative may divert its resources slightly, there is no evidence that this is diminishing its imports into the region. China’s interest in the region has been driven by its commodity-hungry export-led growth model, and as this model focuses on high-end consumption, the role of Sub-Saharan Africa in providing both precious metals and stones and automotives will increase.
Telecommunications infrastructure is developing quickly: The region’s telecommunications infrastructure is being built on the back of China’s inward investments and imports and this is critical to its growth. Kenya in particular has done well because of its advanced communications technologies.
Commodity dependency is still evident: Trade with countries outside of the region is important and driven by trading partners’ needs for oil and gas, precious metals and stones, and iron ore in particular. This is unlikely to change – these are the region’s strengths. But it is important that the region grows on the back of new sectors such as telecommunications, while developing infrastructure to support exports in these sectors.
Risks remain: Africa’s data is poor and, as a result, foreign investors may see the lack of transparency as an obstacle to investment. This has certainly not affected Chinese investment, but the drop in trade finance and the reduction in US imports and exports may reflect the concerns around AML and KYC that global banks and regulators might have.
There is substantial growth potential in the region, particularly through services and telecommunications, but also through more traditional sectors. The next few years and the relationship with China will be important drivers of the development of trade in the region.
Rebecca Harding, independent economist