
The economic and political context
The economic and political context of trade in the UK has been dominated by Brexit since June 23, 2016 – the day the British public voted to leave the European Union. Brexit will continue to be the backdrop to all of the UK’s trading relationships, whether in goods or services, and whether with the EU itself or with partners outside of the bloc. At present, the nature of the arrangements that will exist between the UK and EU after Brexit in March 2019 is unclear. What has been mooted is:
- An arrangement modelled on the deal that Canada has with Europe – the Comprehensive Economic and Trade Agreement (Ceta) – this covers goods trade but not services and allows regulatory divergence;
- An arrangement modelled on Norway’s relationship with the EU, which includes services and avoids regulatory divergence but requires acceptance of the ‘four freedoms’ of the single market (freedom of movement of goods, services, capital and people) and a payment to be in the single market.
It is not the purpose here to discuss which option is preferable. Both will require a transition period for businesses and financiers to adapt to the new systems.
What’s clear is that while the outcome of talks remains uncertain, it is difficult for the UK’s international businesses to plan. A September 2017 Santander survey showed that while UK firms were almost unanimously confident about their growth over the next year, they were also deeply concerned about the risks inherent to Brexit and how these might affect their operations. It was not, however, Brexit itself that was the main concern of the respondents in the Santander Trade Barometer. 73% of the sample of 1,000 businesses said that a UK economic slowdown would negatively affect their businesses.
That the prospect of economic slowdown was the primary concern of the survey respondents highlights the real challenge for the UK as it steers itself through what will be a difficult year in 2018.
The UK economy performed remarkably well in the immediate few months after the referendum. There was no immediate outflow of capital, nor did banks and businesses decide to leave the UK overnight. The Bank of England’s macro-prudential measures on the day after helped to stabilise markets so that any impact of the vote itself was minimised. Employment has remained at record levels and the weakness of sterling has arguably helped UK exporters, particularly in the service sectors.
However, the flipside of the weaker sterling is that import prices have risen and this has fed directly through into higher inflation, which peaked in November 2017 at 3.1%, at which time food price inflation was 3.6%. Higher oil prices and increased service costs are adding to the burden on households whose real income is not growing fast enough to keep up with higher inflation. As a consequence of these trends, economic growth has been weaker in 2017 and an average of all independent economic forecasts suggests that growth in the UK in 2018 will be just 1.4%.
Disclaimer
This Trade Briefing is an overview of the UK’s current trade position, based on existing trading patterns in goods and services. There is some analysis of what trade might look like in five years’ time, but this is based on momentum projections of the patterns in the data over the last 20 years and not on assumptions about what the UK’s trading relationships will be either with the EU or other countries. The projections also do not make assumptions about rates of growth, inflation or unemployment. They are simply derived from the trends in the numbers themselves.
Given that no Brexit deal has yet been struck by the time this publication goes to print (in February 2018), and given that the UK is still part of the EU, this approach allows us to understand the challenges for policy, business and banks from the trends that are evident today.
The analysis here is put together objectively from United Nations data that is uniquely mirrored, cleaned and harmonised using standard OECD techniques applied across the goods and services trade from the UK with all of its nearly 200 trading partners. It reports on trade values in US dollars for comparative purposes and, because it is derived from multiple sources, including the UN, Eurostat, the OECD and customs and excise data as well as the UK Office of National Statistics data, these values may differ in absolute terms to those used by the UK government.
UK goods trade overview
The UK’s goods trade position globally has become weaker over the past 20 years: as a share of world trade, imports have fallen by one third and exports by over one half (Figure 1).
In 1996 the world’s top six exporting nations were, in descending order, the US, Germany, Japan, France, the UK and China. In 2016 the top six exporting nations were, again in descending order, China, the US, Germany, Japan, South Korea and France. Only China and South Korea have seen their share of world exports increase over that period – China by nearly 170% and South Korea by 17%.
The UK’s share of world exports has dropped by more than the US, Germany, France or Japan, which places it in a weakened position compared to these other high-income economies.

The EU27 is the UK’s main trading partner (Figure 2). It accounts for 46.3% of the UK’s goods exports, while North America accounts for 17.2% and Asia Pacific just 7%. The large “other” category includes countries such Norway and Russia which are outside of the groupings reported here.
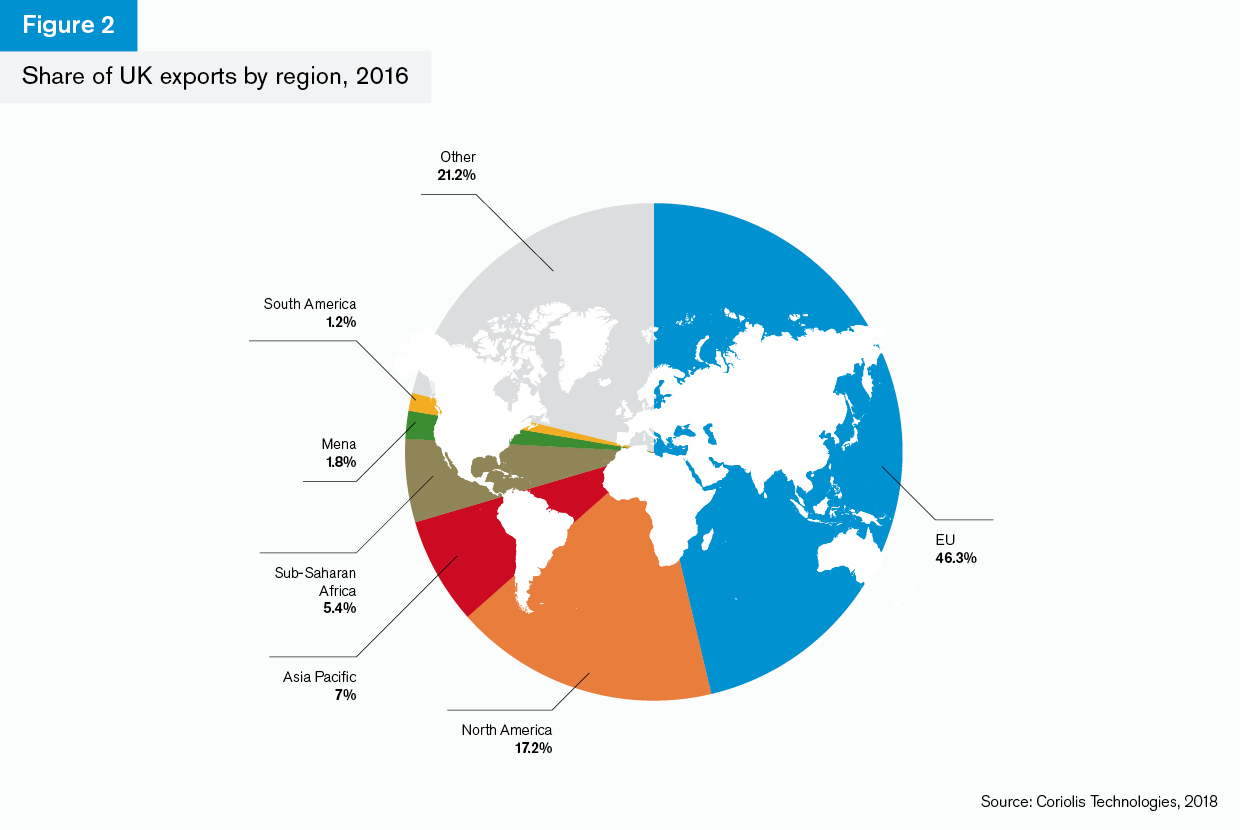
The UK exported some US$201bn in goods to Europe in 2016. This compares to US$74bn to the US and US$30bn to Asia Pacific. It is unlikely that these proportions will change in the near future.
Annualised growth in UK trade with the EU27 was negative between 2012 and 2016 and is projected to shrink further, albeit at a slower rate, to 2021. Exports to the Asia Pacific region have grown and are projected to grow, but these growth rates are insufficient to act as a substantial substitute for the European market.
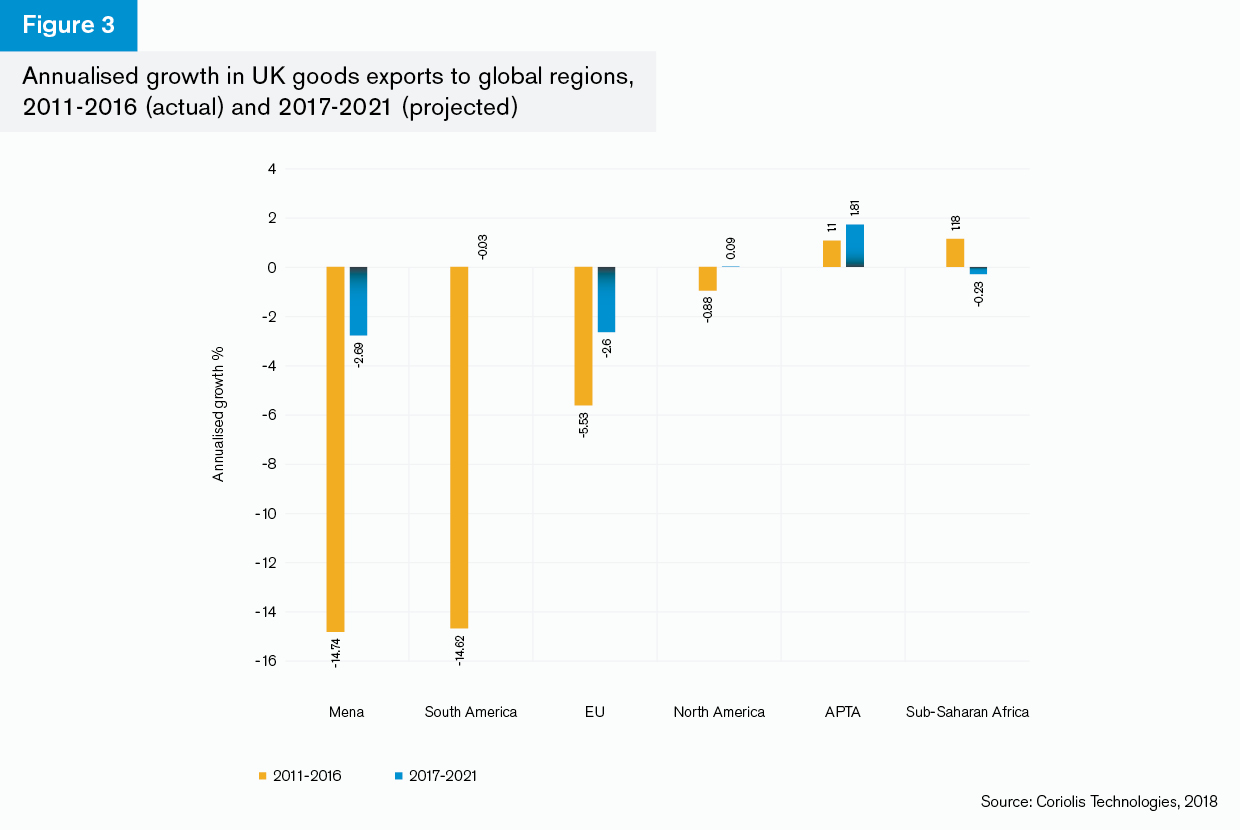
The fact that UK export growth has declined in this way has to be seen in context: global trade growth between 2012 and 2016 declined at a rate of 2.8% annually and is projected to grow at an annualised rate of just over 0.1% to 2021. Context is everything; although in goods trade terms, it does appear that the decline in UK trade has been greater than the decline in world or European trade (Figure 4).
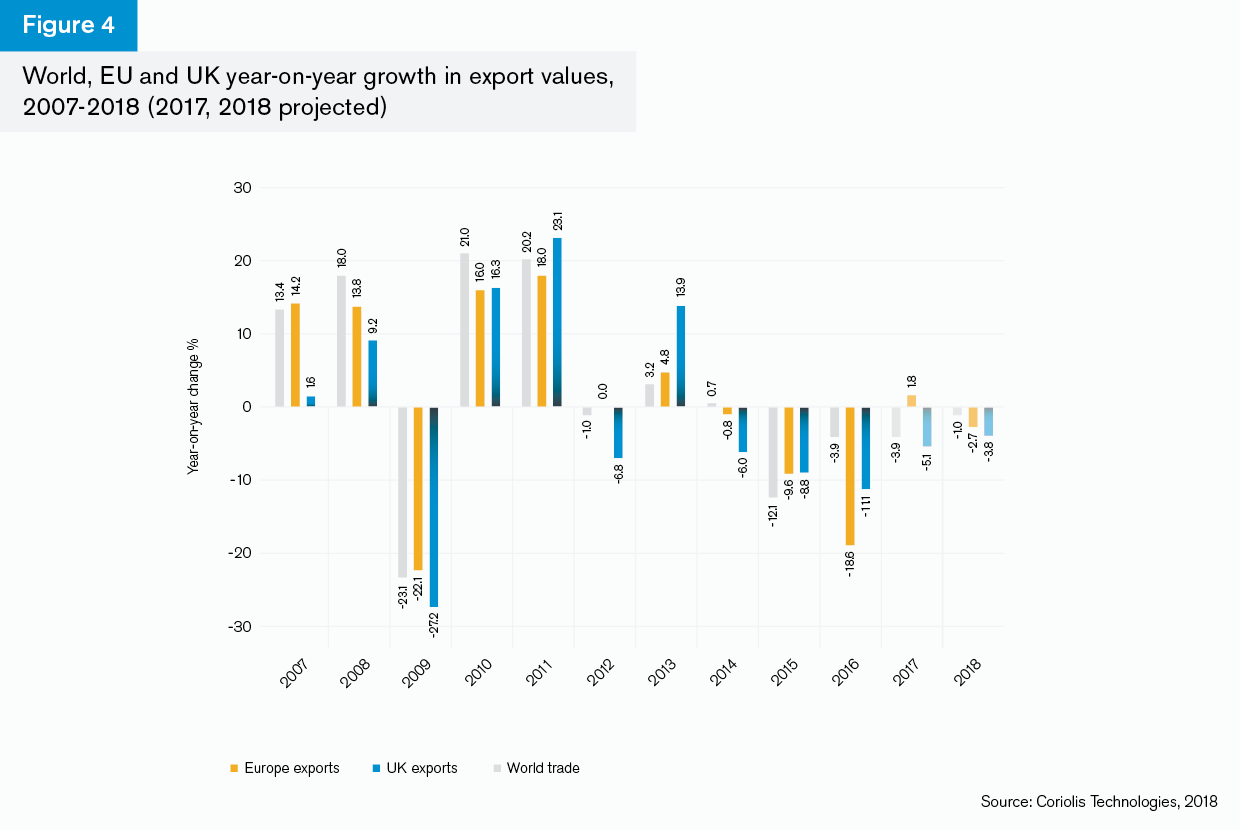
Between 2007 and 2010, the UK’s growth in export trade values was lower and its contraction sharper than the world and, in most cases, the EU as well. The recovery in 2011 was driven by weaker sterling but UK export values fell back again in 2014 more sharply and have been negative since, despite the sustained weakness in sterling.
Because the UK is heavily dependent on imports, one effect of weaker sterling has been to push up the value of imports into the UK, thereby widening the trade deficit particularly sharply since the financial crisis (Figure 5).
The increase in the budget deficit was particularly marked in 2016: export values fell because of weaker sterling and import values increased.
Ironically, while export trade volumes themselves may have increased, their values through the whole year and into 2017 have not, meaning that the deficit remains an ongoing issue for the UK economy.
In itself, the dependence on imports is little cause for concern in a global economy. Where supply chains are global, exports are highly dependent on imports. For example, in 2016 the UK exported some US$45bn of cars in value terms. However, it imported components worth at least 42% of this value: US$192.2mn in chassis, US$641.2mn in car bodies, US$15bn in parts and accessories, US$1.2bn in car headlights and windscreen wipers, and US$1.8bn in engines. As there are up to 30,000 components that make up one car, the actual value is likely to be far higher than this.

UK goods exports, the value of sterling and the importance of European supply chains
The UK’s trade deficit can be explained in terms of the specific role that UK exporters play in complex global supply chains. This helps to explain why the lower value of sterling has not helped to improve the trade deficit since the global financial crisis: the correlation between the value of sterling against the US dollar and the trade deficit is extremely weak at just 7%. Similarly, the correlation between the value of sterling against the euro and UK exports is weak at just 4%.
The popular narrative since the Brexit referendum has been that weaker sterling will have a positive effect on the UK’s exports. As the country moves closer to Brexit, if sterling weakens further, it should mean that exports are boosted further. Since 2010 there does appear to be a reasonable correlation of 61% (Figure 6).
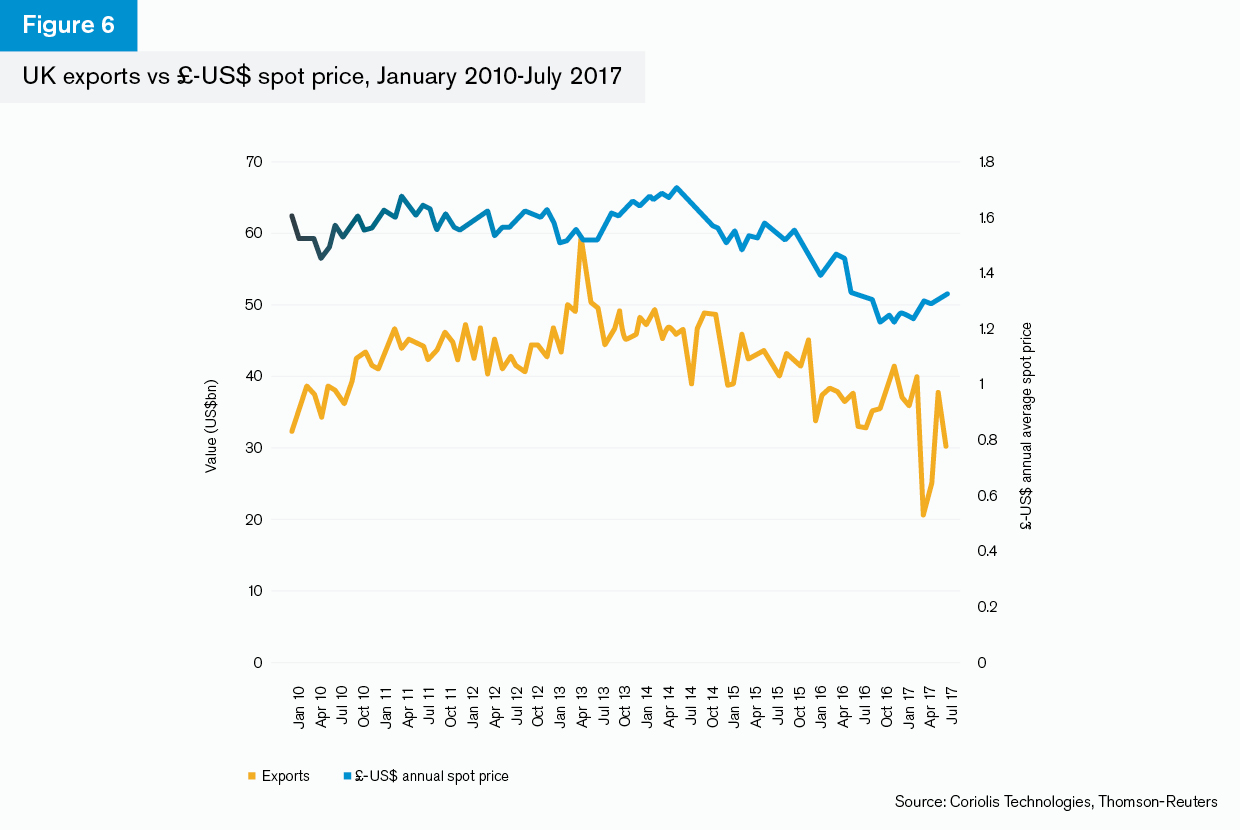
However, there is a weaker correlation between the value of sterling against the US dollar when it comes to imports (not shown on chart): at 48%. In other words, the value of sterling can only explain just under half of any alteration in the value of imports – there are other factors at play (such as the nature of UK consumer demand, which tends to be oriented strongly towards high-end products, as well as the dependence on component supplies).
This means several things: first, the weaker value of sterling against the dollar has a positive effect on exports outside of the EU, but sterling’s overall weakness does not impact either the balance of trade or exports to Europe. Second, imports are likely to increase irrespective of the value of sterling. This is happening because dollar-denominated trade is very different to the trade that the UK has within the European Union. EU trade rests strongly on European supply chains, particularly in the biggest sectors such as cars, pharmaceuticals, electronics and aerospace. Trade outside of Europe, however, is less reliant on supply chains and more reliant on prices. In other words, policymakers cannot rely simply on the value of sterling to boost exports and close the goods trade deficit but should treat the UK’s European trade as a special case because of its closeness to Europe’s supply chains.
UK goods exports and imports
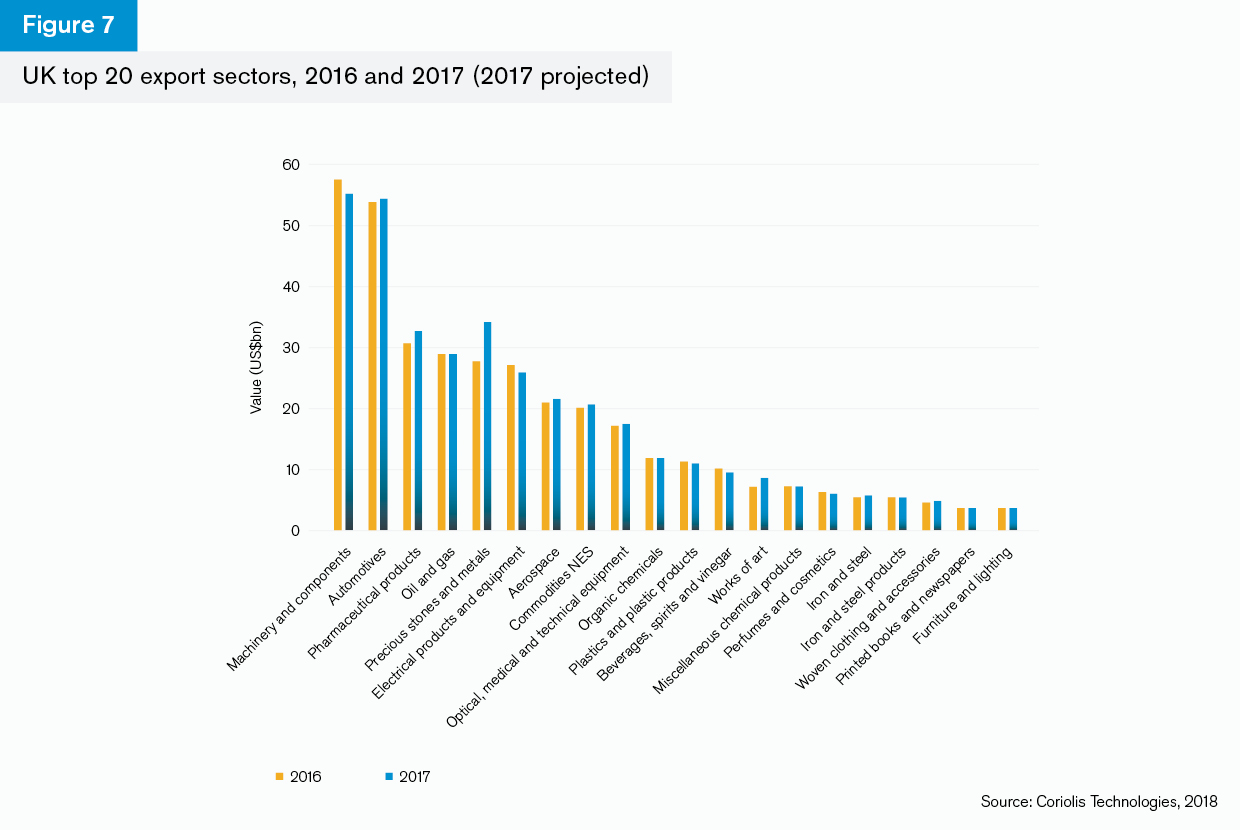
The UK’s top 20 export sectors highlight why global supply chains are important to the UK economy (Figure 7). The top three sectors, machinery and components, automobiles and pharmaceuticals are all closely integrated with European supply chains. While oil and gas and precious metals (particularly gold) exports are highly correlated with the prices of those commodities, the sixth and seventh-largest export sectors are electrical products and aerospace, which are also highly integrated into European supply chains.
The chart also shows that export values in these sectors in 2017 remain fairly flat or negative, with the exception of precious stones and metals, which is predominantly gold.
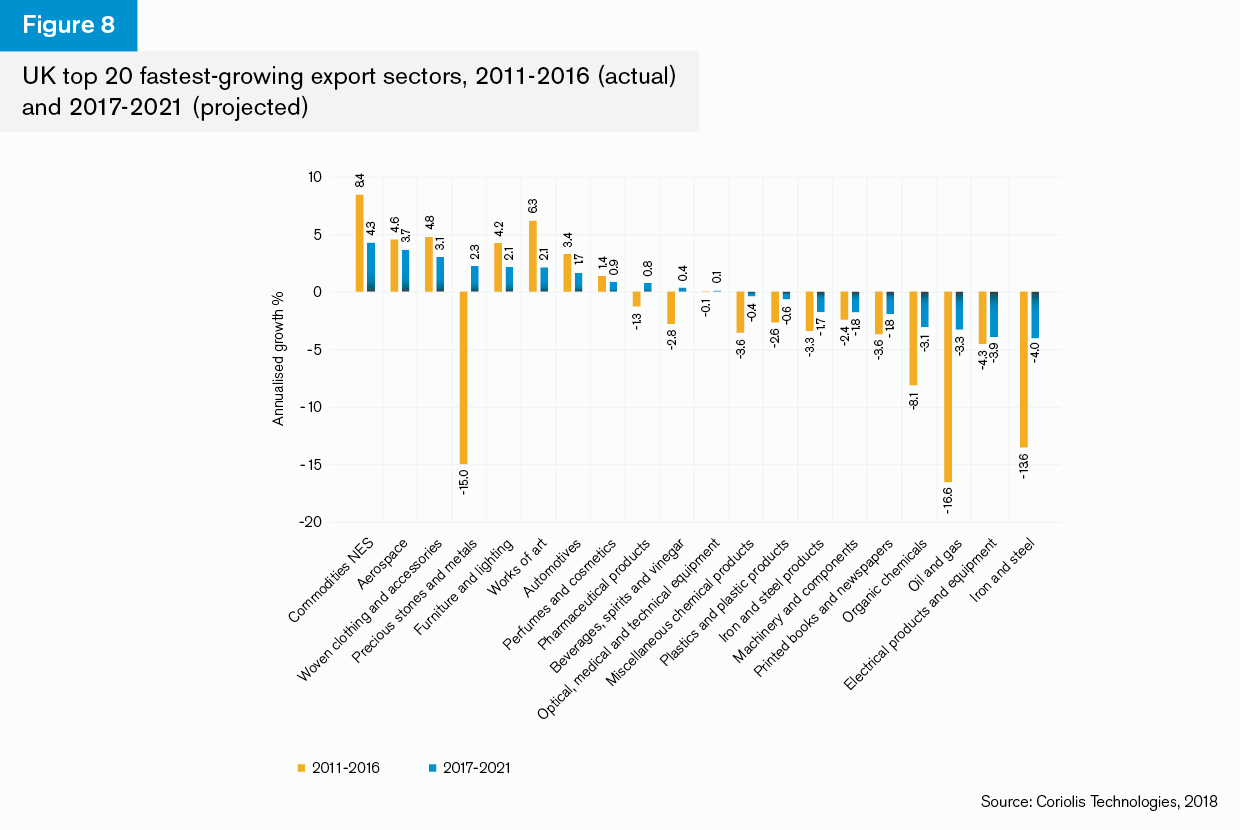
In Figure 8, the UK’s fastest-growing goods export sector is commodities not elsewhere specified (NES), which is also the country’s eighth-largest export sector. This sector is not defined by the UN as such but is commonly associated with goods that are outside of normal customs and excise duties for classification purposes. It is highly correlated with arms and ammunition, oil and gas and precious metals trade and can be seen as “strategic” in the sense that it is associated with political, economic and energy security. Its place as the fastest-growing sector between 2011 and 2016 and as the projected fastest-growing sector to 2021 highlights the strategic nature of UK trade: while the UK is not the world’s largest trading nation, its trade is heavily concentrated in strategic sectors, not all of which are transparent.
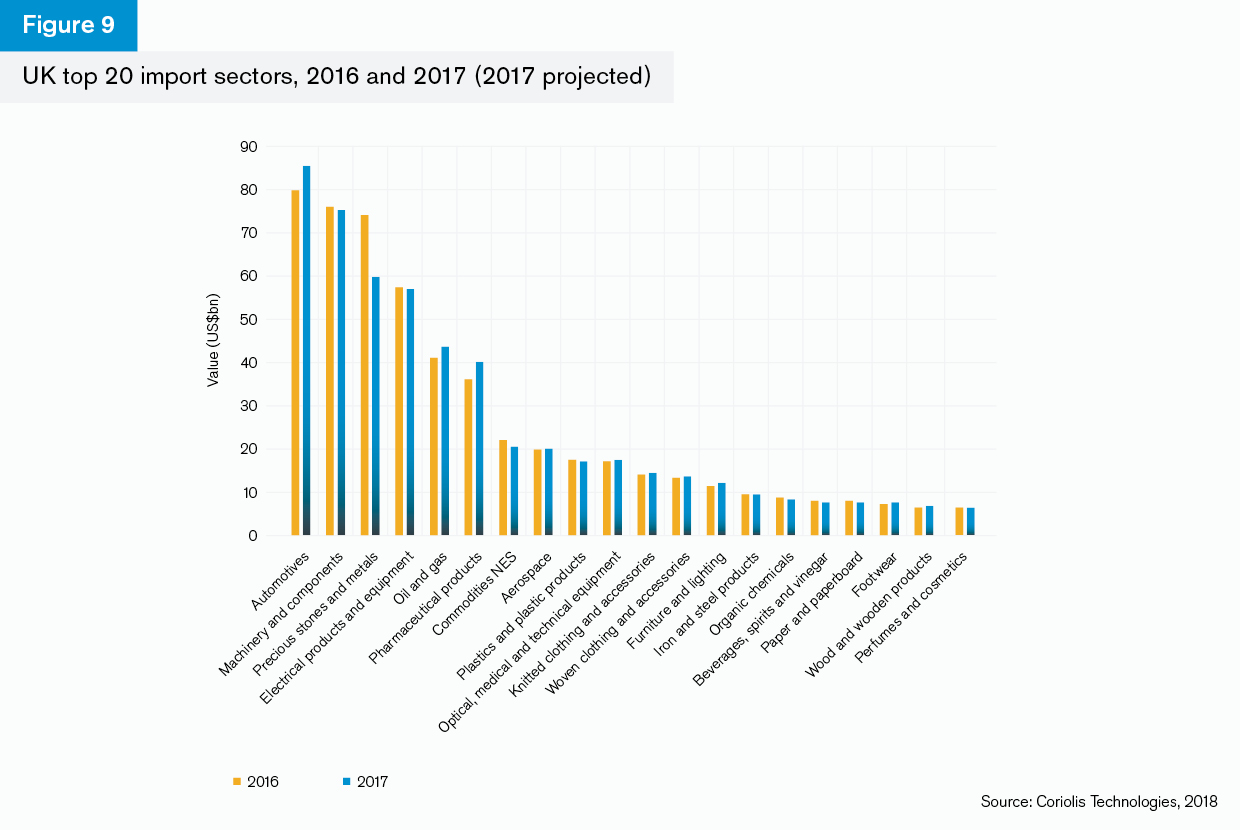
The UK’s top 20 import sectors are very similar to its top 20 export sectors (Figure 9). While the ranking is slightly different (automotives are the largest import sector, for example), the role of imports in supply chains is highlighted by the dominance of the automotive sector, machinery and components, electrical products and equipment and pharmaceuticals in the country’s top imports. As previously suggested, the weaker sterling is likely to have slightly pushed up import values in 2017 across most sectors.
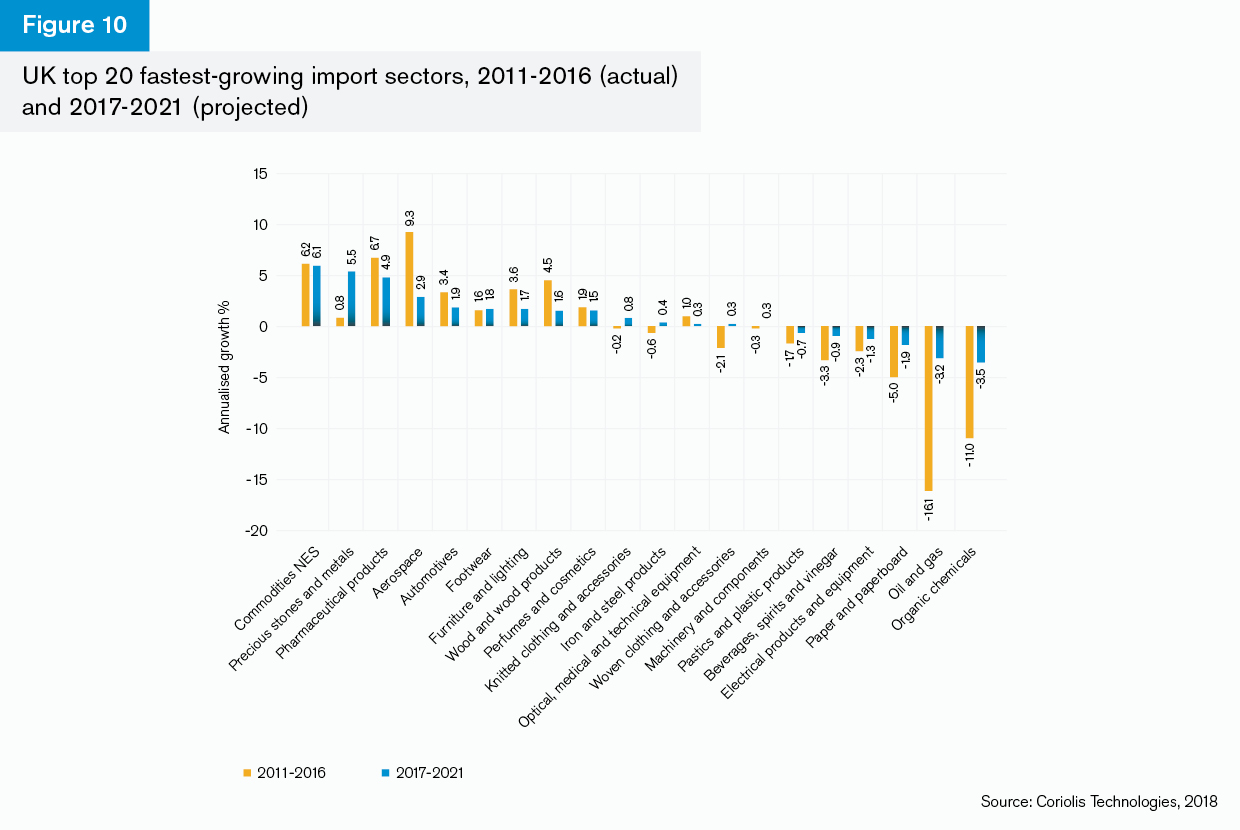
As with exports, the UK’s fastest-growing import sector is commodities NES. This highlights how important this sector grouping is, despite its opaque nature. Annualised import growth is projected to be around 6.1% over the next five years including 2017, which, along with the 4.3% growth in UK exports, suggests that this “strategic” trade is an important part of the UK’s trade relationships with other countries.
The UK is similarly projected to see import growth in pharmaceuticals, aerospace and automotives. Although the rates of growth are slower than the previous years from 2011, this growth suggests that, based on current momentum, the UK will remain an important part of these supply chains. More consumer-oriented imports, such as footwear, furniture, clothing and perfumes, are also set to grow, perhaps indicating that consumer demand will remain strong.
UK goods trading partners
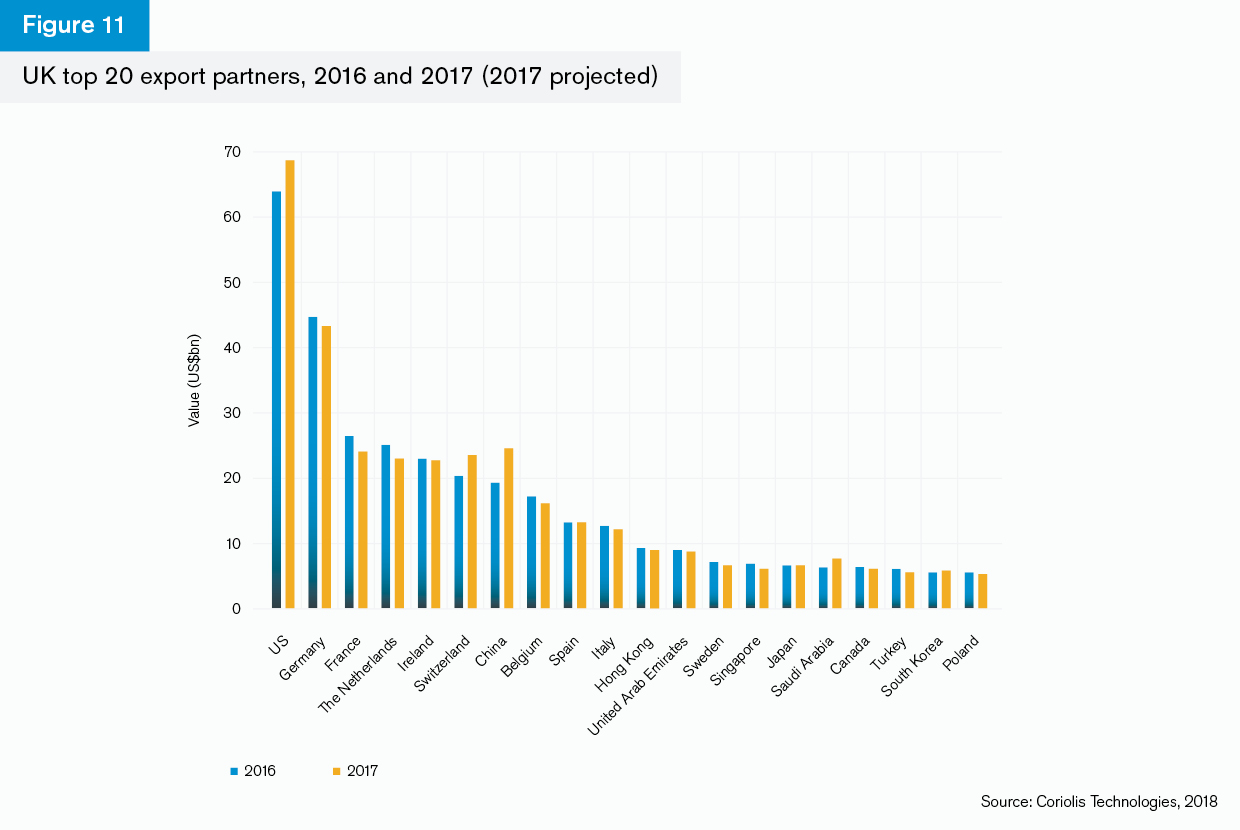
The UK’s largest single-country trading partner is the US (Figure 11). Exports to the US were worth some US$73bn in 2016, which was just over 55% higher than the value of exports to Germany of about US$47bn. Exports to the US are projected to gather momentum during 2017 but fall back with the largest EU partners. Trade with Switzerland in 2017 appears to grow, but much of this is driven by exports of precious stones and metals and by works of art. Similarly, UK exports to China also gather momentum in 2017 largely because of projected increases in oil and gas and precious stones and metals exports.
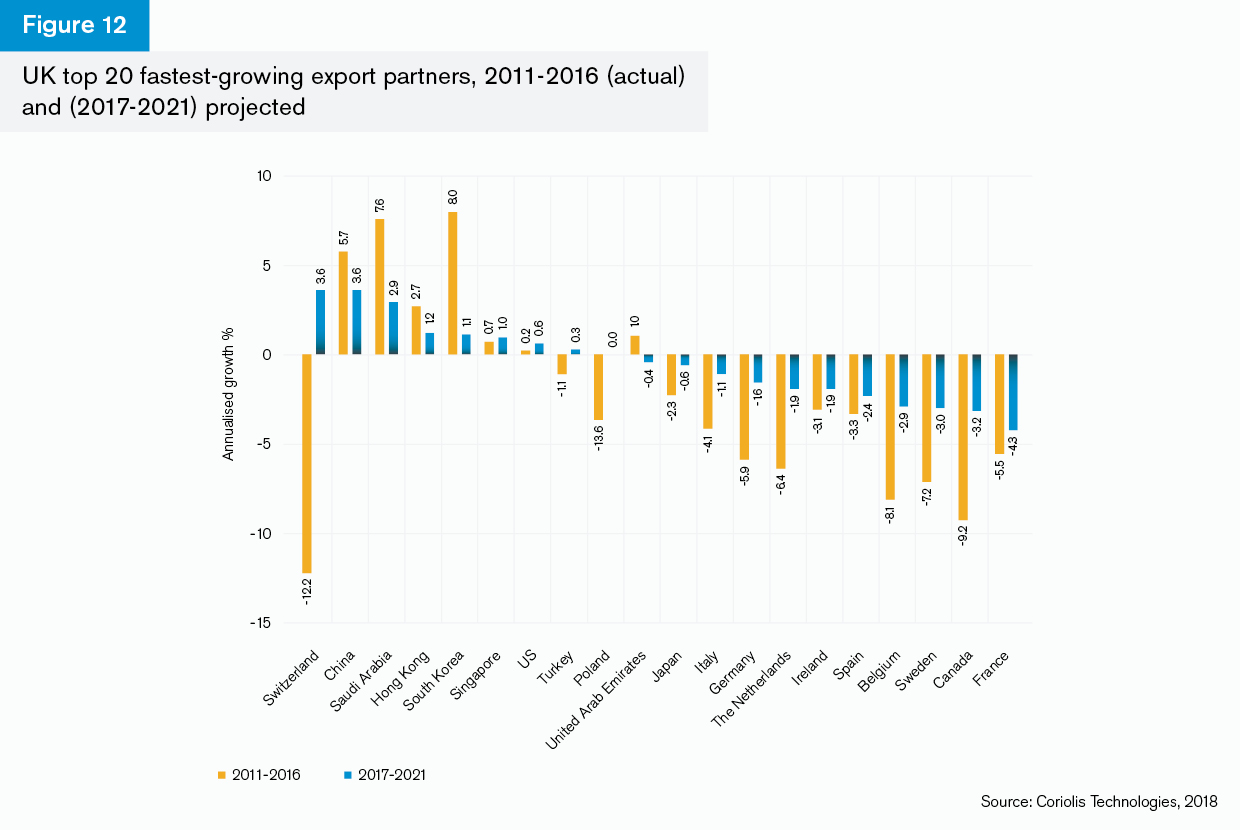
All of the partners where growth is projected for UK exports are outside of the EU. Switzerland and China are projected to be the UK’s fastest-growing export destinations in the period to 2021 (Figure 12). Saudi Arabia, Hong Kong and South Korea will see slower growth than in the five years to 2016, but the value of exports to Singapore are projected to increase.
As with some of the analysis earlier in the Trade Briefing, however, this does not mean that these countries will substitute for Europe: eight of the UK’s top 10 export partners are European.
Even if goods trade growth is more rapid amongst Asia Pacific and Middle East countries, these are a small proportion of the UK’s trade.
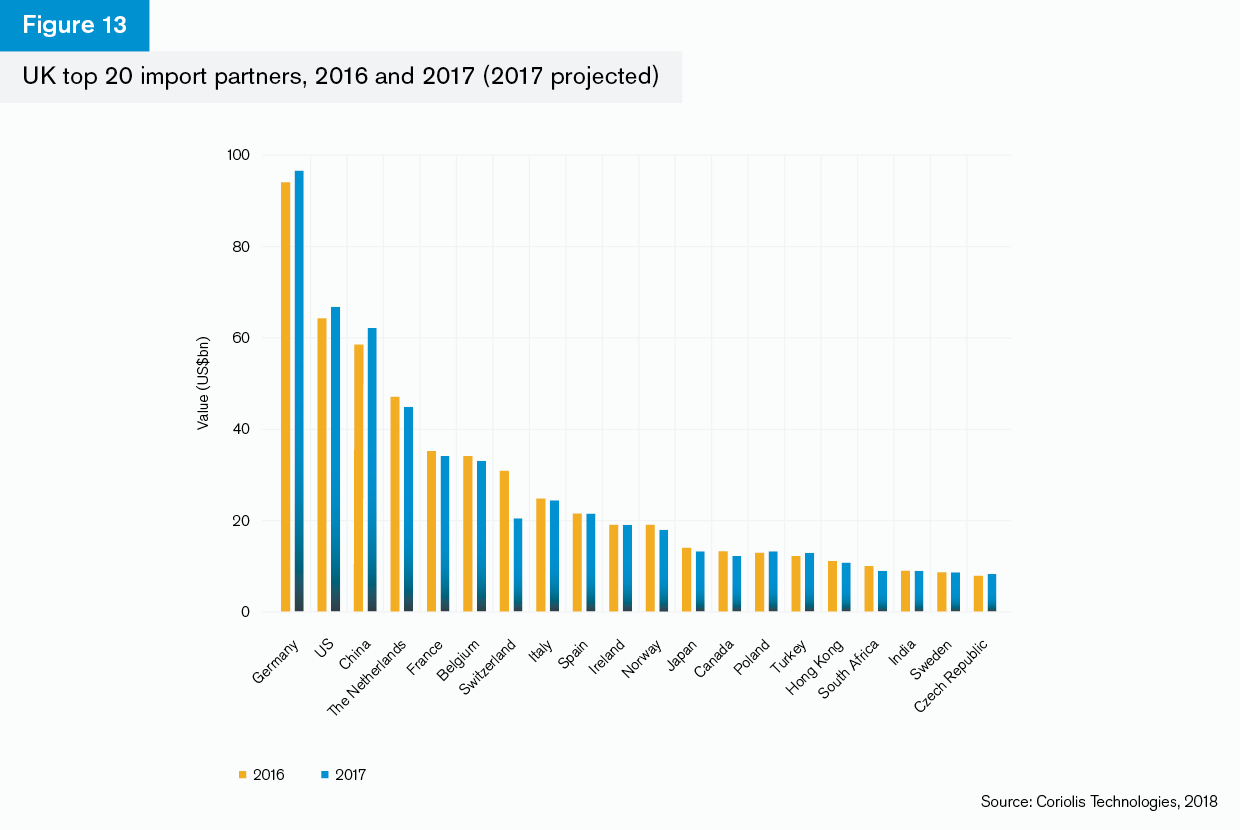
The UK’s largest goods importers are Germany, the US, China, the Netherlands and France (Figure 13). Germany imported 32% more into the UK in 2016 than the US at just over US$94bn. This is projected to have grown by nearly 3% in 2017. Imports from the US and China are also projected to have grown, which is unsurprising given that overall UK goods import values grew in 2017 because of the weakness of sterling. As with exports, eight of the UK’s top 10 largest import partners are European.
The fastest-growing import partners are not necessarily those outside of Europe (Figure 14). For example, imports from Poland are projected to grow by 3.1% annually to 2021 while imports from the Czech Republic are projected to grow at an annualised rate of 2.8%. These are important partners within automotive supply chains, and it again pulls together a picture of the importance of imports as well as exports to the UK economy. The fastest-growing sector imports into the UK from Turkey are in the automotive and parts sector with projected year-on-year growth between 2016 and 2017 of over 20%.

Import partners
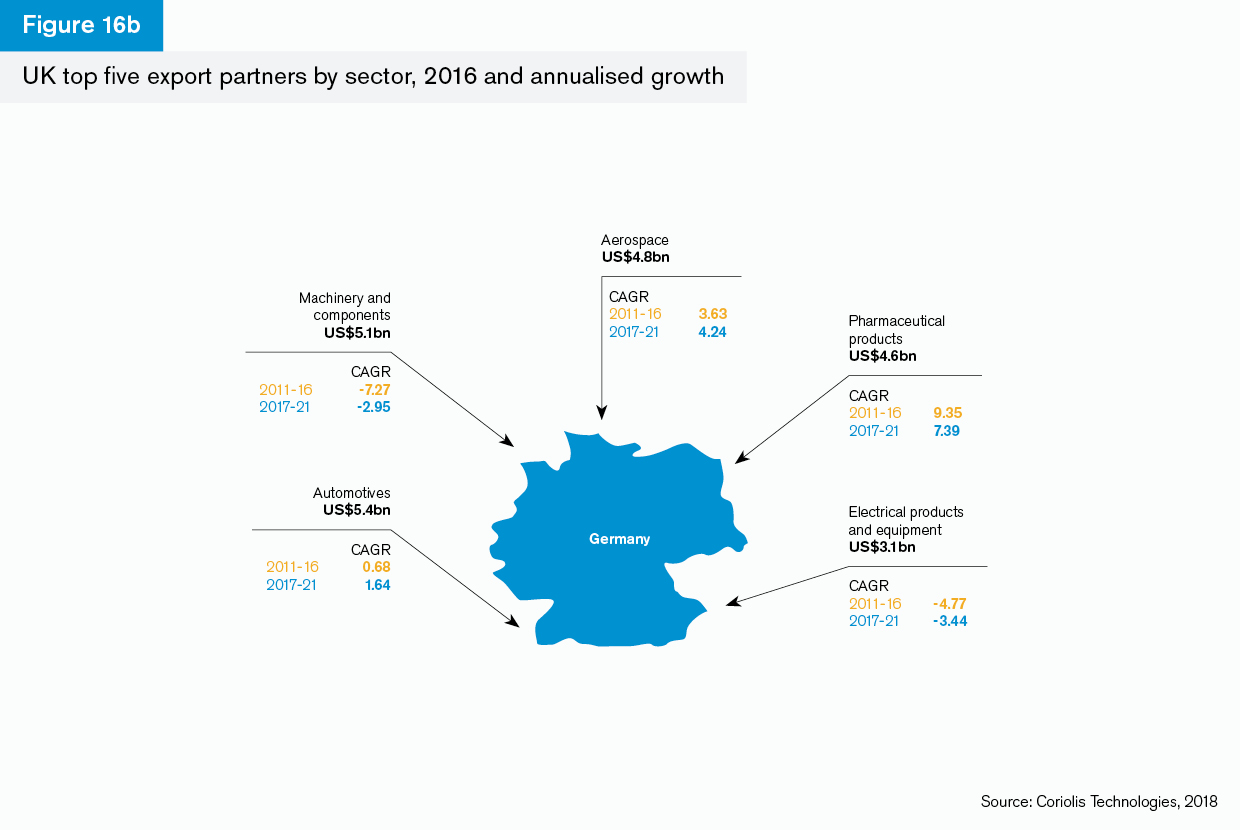
Germany
The fastest-growing import sector from Germany to 2021 is projected to be pharmaceutical products. Automotive imports are also projected to grow, but machinery and components and electrical products and equipment are projected to slow in value terms at least. The second strongest growth import sector is commodities NES, which may reflect sustained strategic interests between the two countries. The fact that automotives and pharmaceuticals imports look set to grow suggests that European supply chains in these sectors that originate in Germany will remain strong in the UK’s trade mix.

US
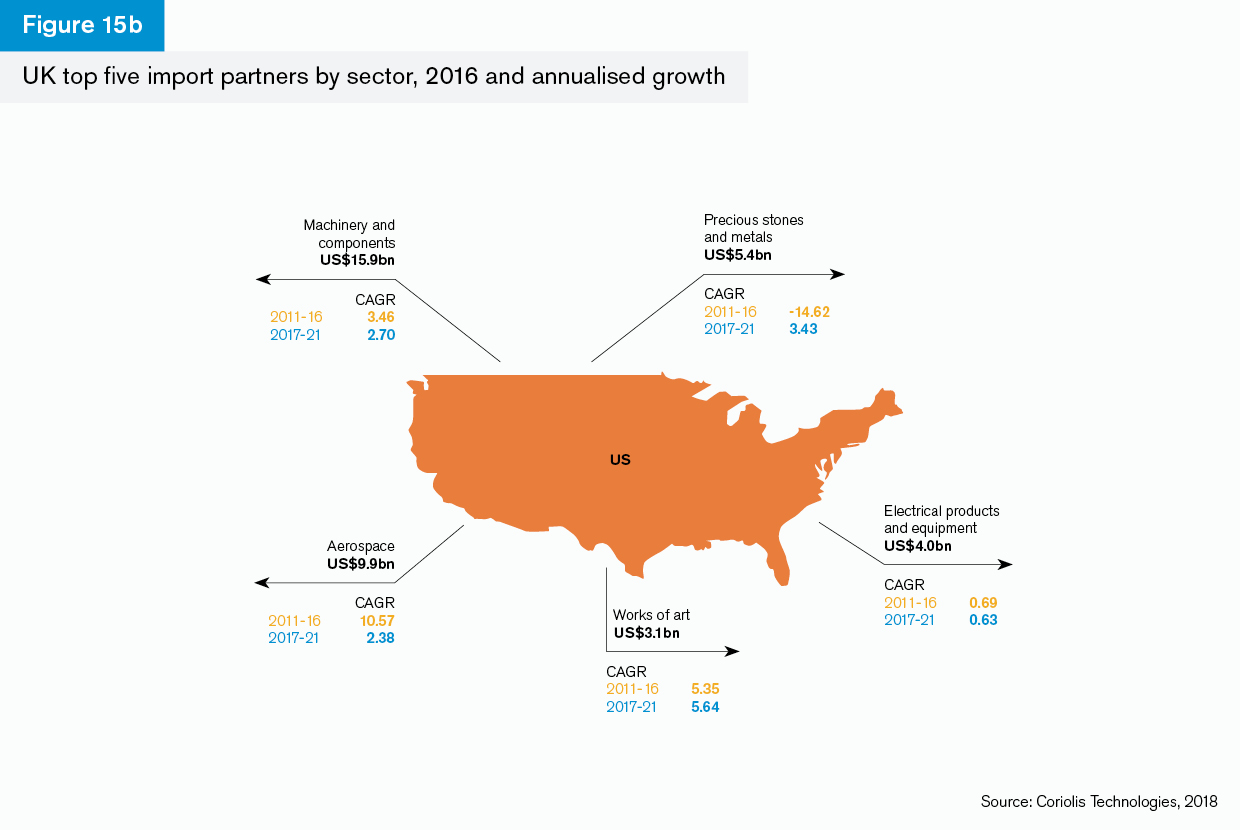
Imports from the US reflect both supply chains and an element of wealth protection. The fastest-growing import sectors from the US, for example, are projected to be precious stones and metals, which is dominated by gold, and works of art, which has grown by over 5% annually since 2011. These are sectors which are used to protect wealth against any instability in the market, and, as such, are “hedge” sectors. In contrast, there is slower, but still substantial projected growth in imports of machinery and components and aerospace to 2021, with modest or flat growth projected in electrical products.
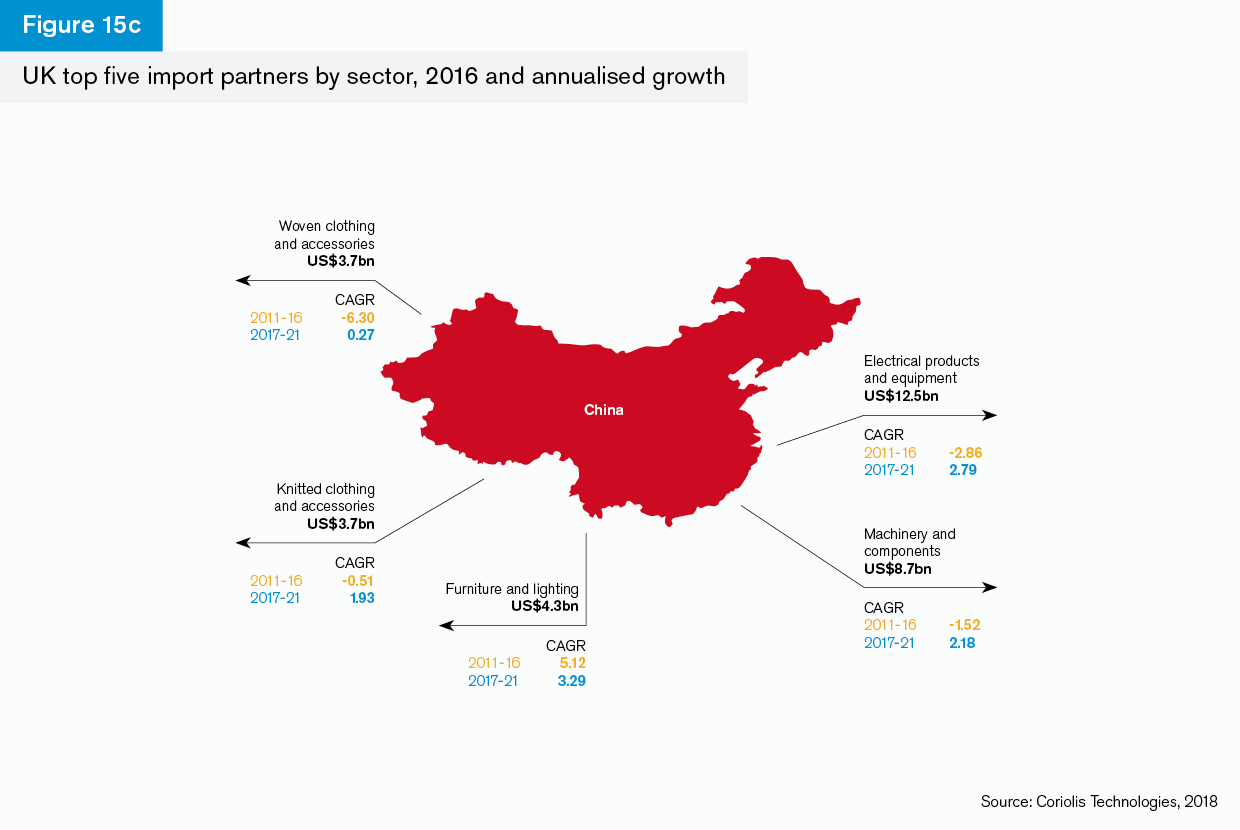
China
The fastest-growing import sector to 2021 from China is projected to be furniture and lighting. Clothes and electrical equipment are also set to grow strongly, as are machinery and components imports. Machinery and components include computers, so imports from China are largely meeting consumer demand for electronic goods, household products and clothes but are not fuelling exports through supply chains as such.
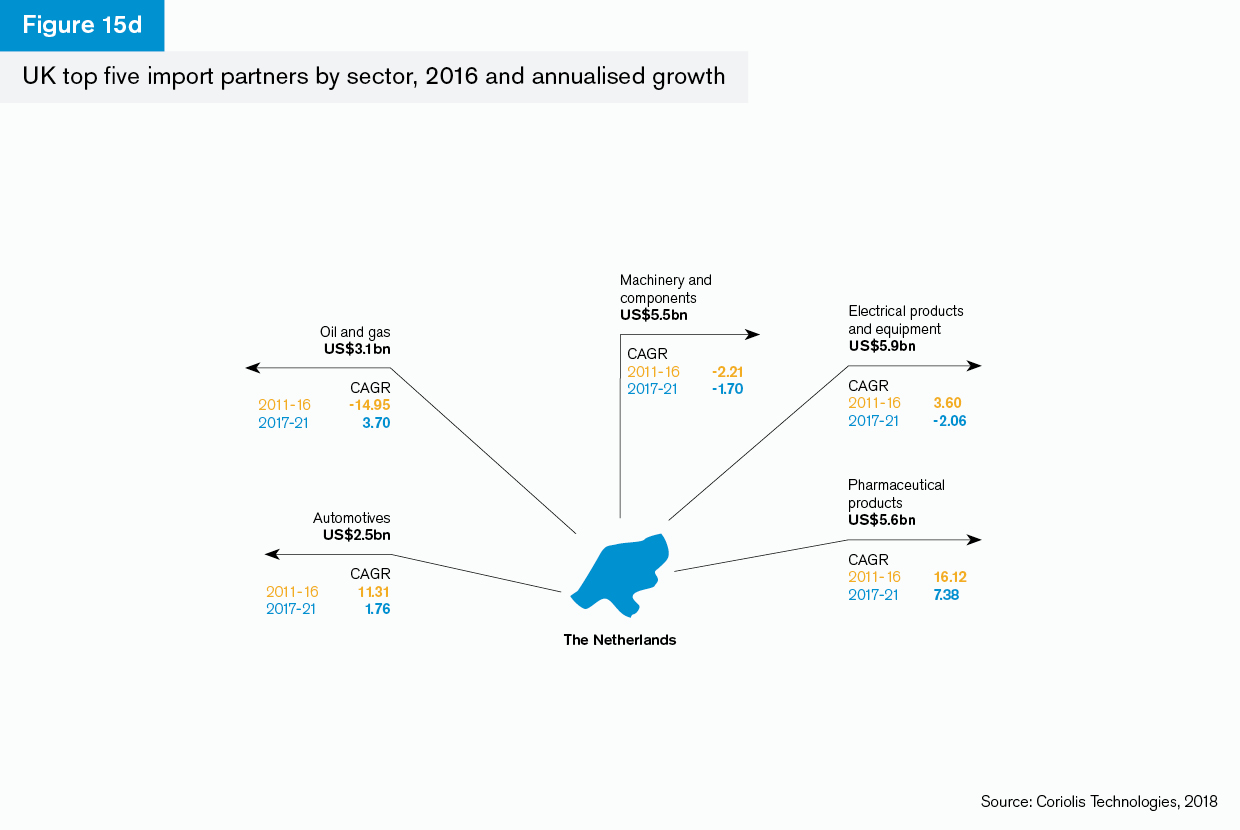
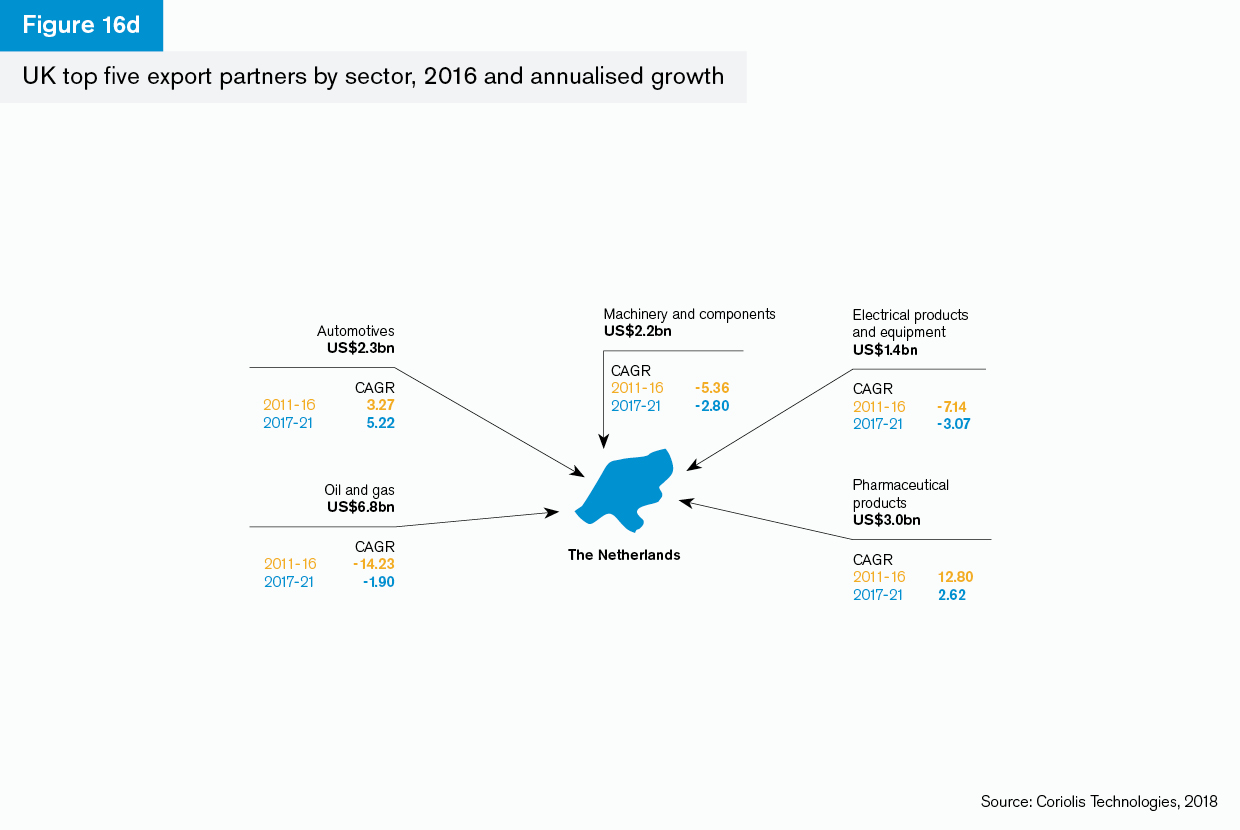
The Netherlands
Much of the trade from the Netherlands comes from other countries and it is difficult to isolate what is specifically coming from the country itself rather than via the Netherlands. This is called the “Rotterdam effect”. The analysis suggests that growth is projected in electrical products and equipment, pharmaceuticals, oil and gas and automotives. It is likely, however, that the complexities of customs and excise post-Brexit may affect trade through Dutch ports: the projections for electrical products and machinery and components highlight this vulnerability.
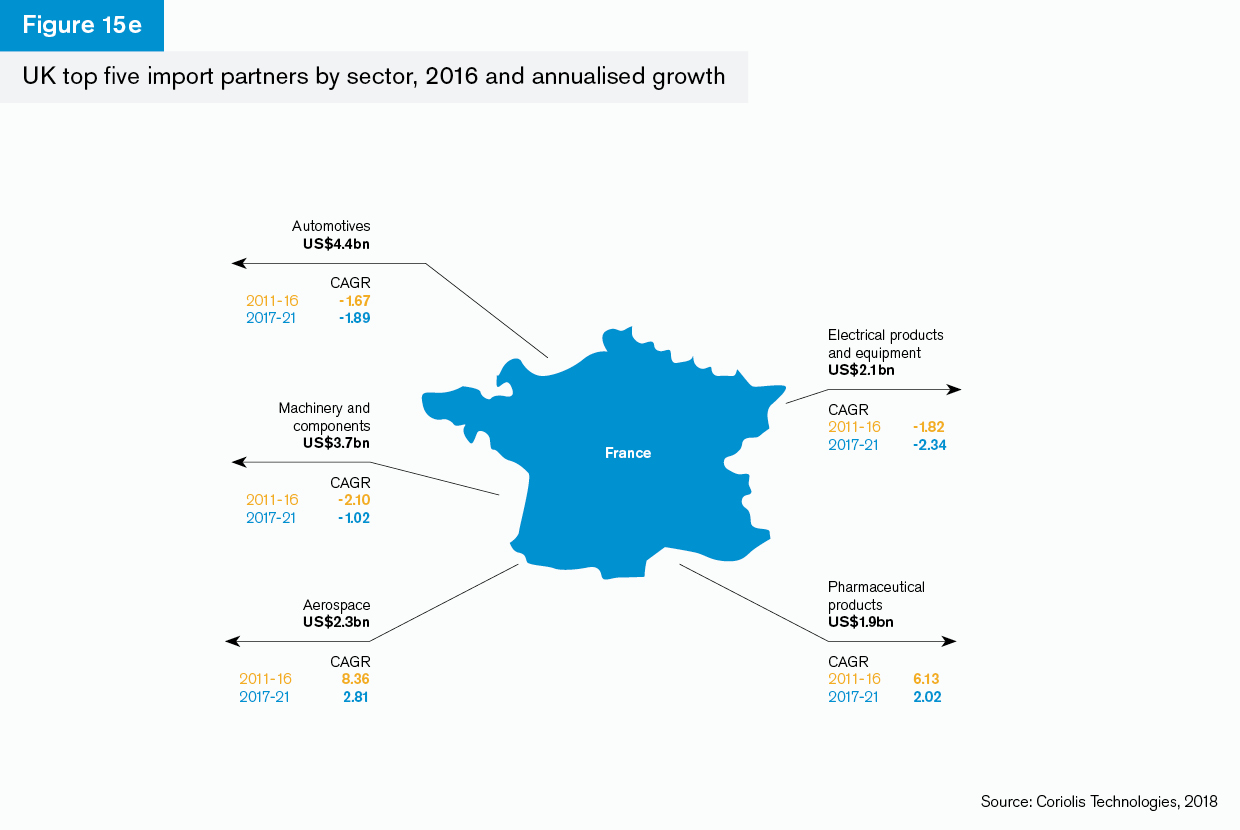
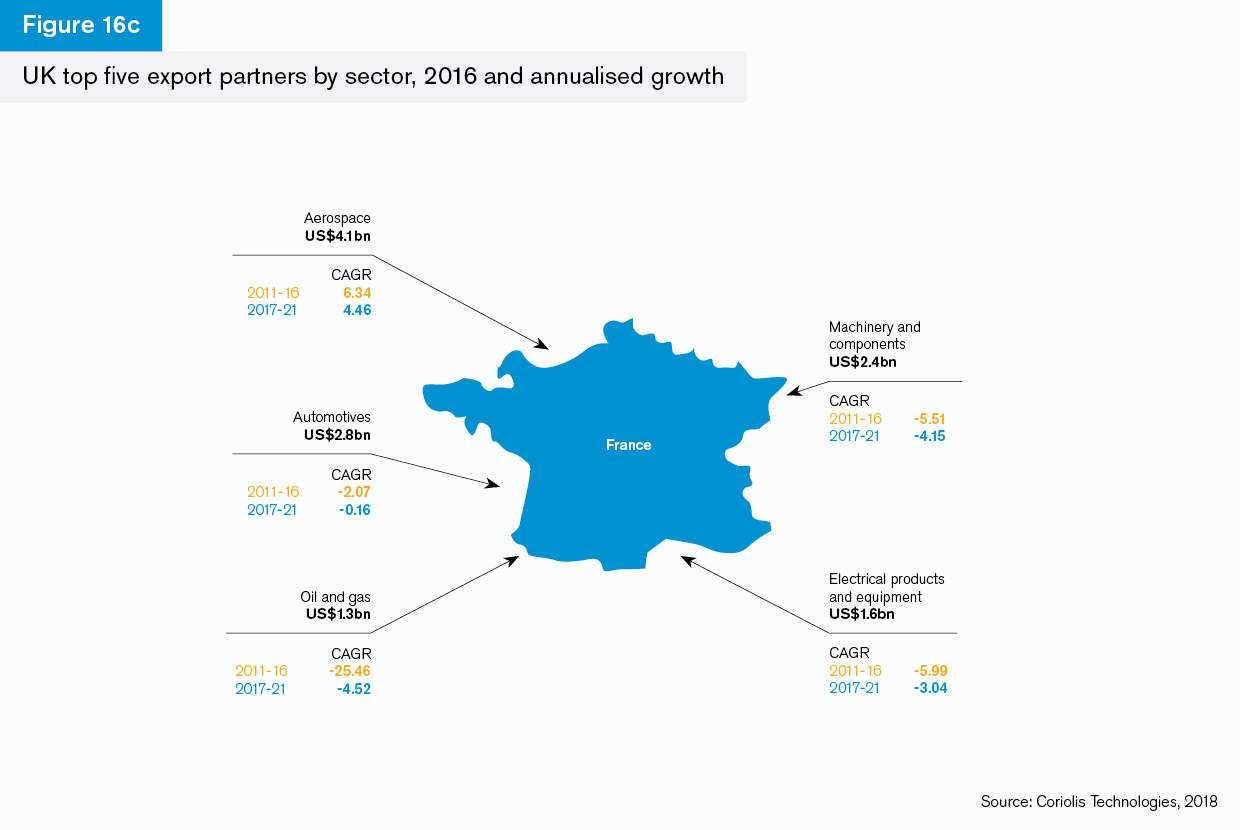
France
The strongest sector for import growth from France to 2021 is aerospace. Even so, this is a significantly lower level of growth compared with the period 2011-2016. Pharmaceutical imports are also set to grow but again at a slower rate compared to the 2011-2016 period. Automotives, machinery and equipment and electrical products and equipment are set to contract in value terms but this may reflect the fact that France itself has outsourced production in these sectors to Turkey, the Czech Republic and Poland – the UK is seeing increased imports from all of these countries.
Export partners
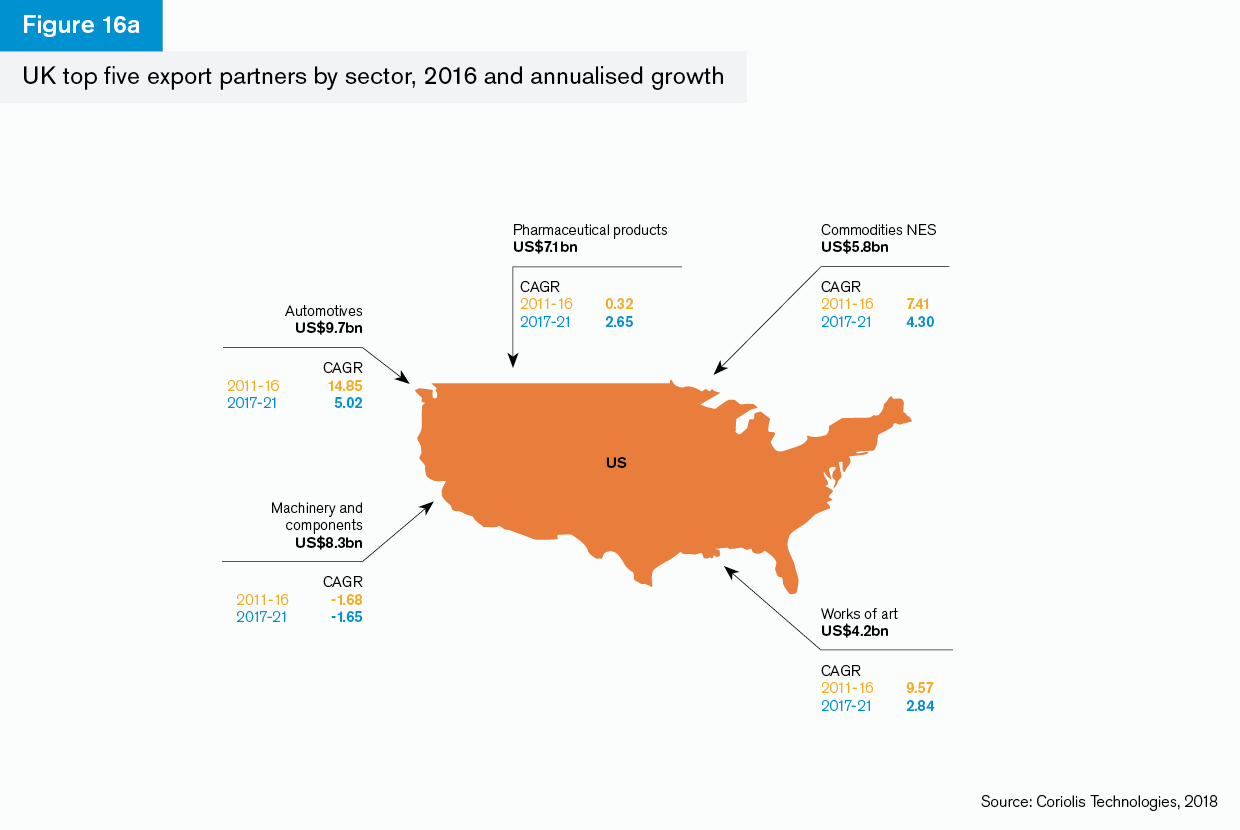
US
The UK’s trade balance with the US fluctuates but currently stands around zero – what is imported from the US is roughly equal to what is exported to the US. That said, the UK has a trade surplus in automotives with the US and this is projected to continue to grow at an annualised rate of over 5% to 2021. Commodities NES is a strong sector for growth (+4.3%) as is works of art, and is forecast to grow at an annualised rate of nearly 3% to 2021.
Germany
Aerospace and pharmaceuticals exports to Germany appear to be the strongest in terms of projected growth to 2021. These are also sectors which could be affected by changes in the regulatory and security regimes post-Brexit. The substantial growth at present in these sectors and the slower, but increasing, rates of growth in automotives suggest that there is a strong base from which to build. The drop in exports of electronic products and equipment may reflect the growth in imports from China across Europe.
France
UK exports to France are only expected to grow in the aerospace sector. This highlights shifting French supply chains towards the smaller European nations and the importance of aerospace in France in particular and across Europe generally. This sector is closely linked with security issues and the fact that aerospace exports are projected to grow so strongly corroborates the importance of this sector both for UK security and for UK trade.
The Netherlands
Oil and gas is the largest sector that is exported to the Netherlands and it has fallen dramatically in value terms since 2011. This reflects the drops in oil prices between 2013 and 2016 which have resulted in the value of this trade falling back at an annualised rate of over 14% year on year. The projected growth in automotives and pharmaceuticals reflects strong future trade with the Netherlands.
Ireland
The UK’s exports of commodities NES to Ireland are expected to grow at a rate of over 4% annually to 2021. Oil and gas exports will fall back in value terms, albeit at a slower rate than in the previous five-year period, reflecting the stabilisation of oil and gas prices. Machinery and components are set to contract from their annualised growth of nearly 1.4% between 2011 and 2016 to an annual slowdown of 2% to 2021. UK trade with Ireland is highly sensitive to the outcome of Brexit negotiations and it is possible that this is already visible in the momentum projections.

Case study: UK trade with Kazakhstan
The UK government is keen to develop its trade relations outside of the European Union and to open up access to China’s emerging Belt & Road Initiative (BRI) that will allow goods to move by road or sea across Eurasia from China into Europe and the UK in particular. Kazakhstan is playing an important role in developing the infrastructure around this initiative and this offers opportunities to UK exporters, not just in oil and gas but also in machinery and components, electronics and consumer sectors like food and drink. The department for international trade (DIT) has prioritised Kazakhstan and the UK trade minister, Greg Hands, made a visit to the country in 2017.
Kazakhstan’s trade relations have not been easy since the financial crisis. It is rich in minerals and natural resources but has been plagued by corruption, particularly up to 2014 which, combined with lower oil and gas prices, has hit its trade severely. Nevertheless, the government has committed itself to a significant anti-corruption drive and is investing not only in infrastructure but also in cultural and economic ties with other Eurasian countries.
This makes the country strategically important for the UK, even if UK trade is currently modest: UK aerospace exports to Kazakhstan were worth US$93bn in 2016, for example.
While trade growth over the five-year period to 2016 has suffered, it is projected to recover during the period to 2021 with food and drink, pharmaceuticals and soft furnishings looking particularly robust (Figure 17).
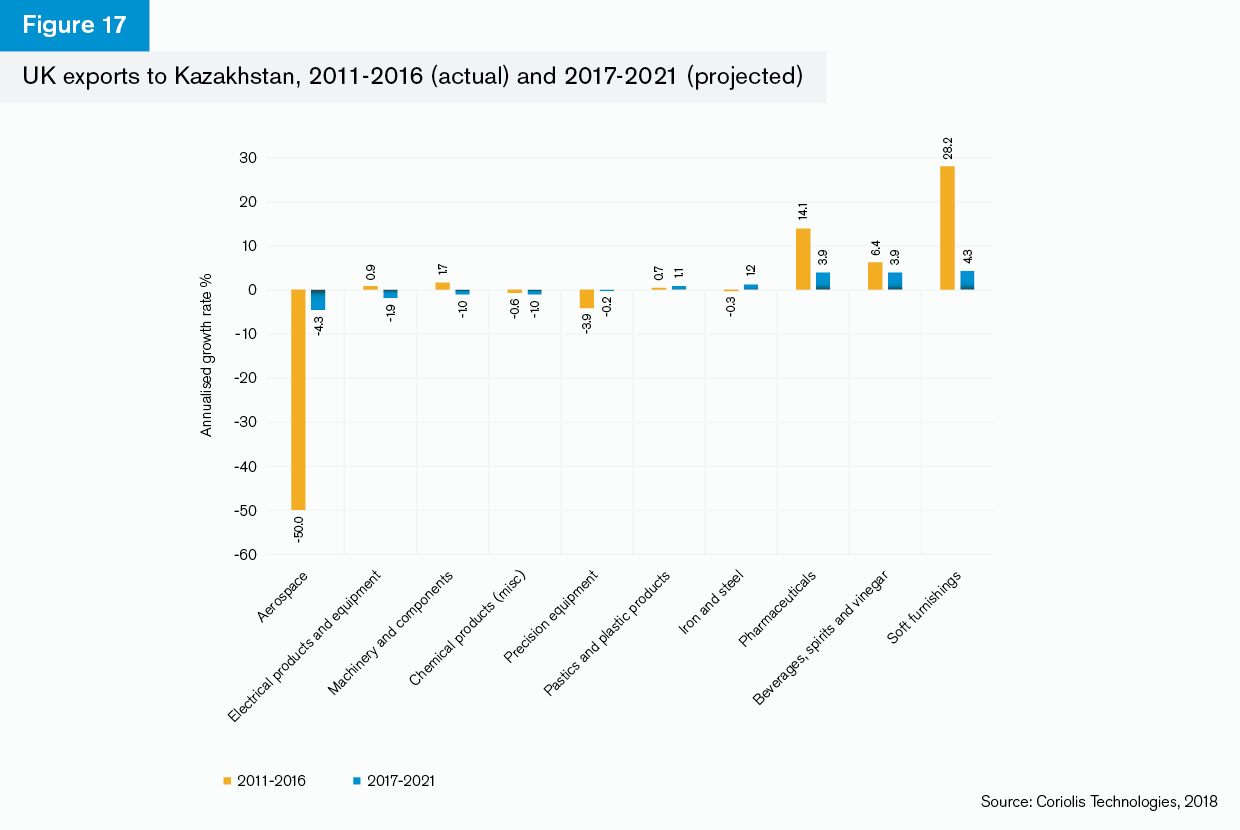
Although export trade in aerospace is expected to continue to decline to 2021, this is at a much slower rate than in the period between 2011 and 2017. This may reflect the reorientation of Kazakh policy away from nuclear deterrence and towards its own independent security strategy, reducing its reliance on Russia.
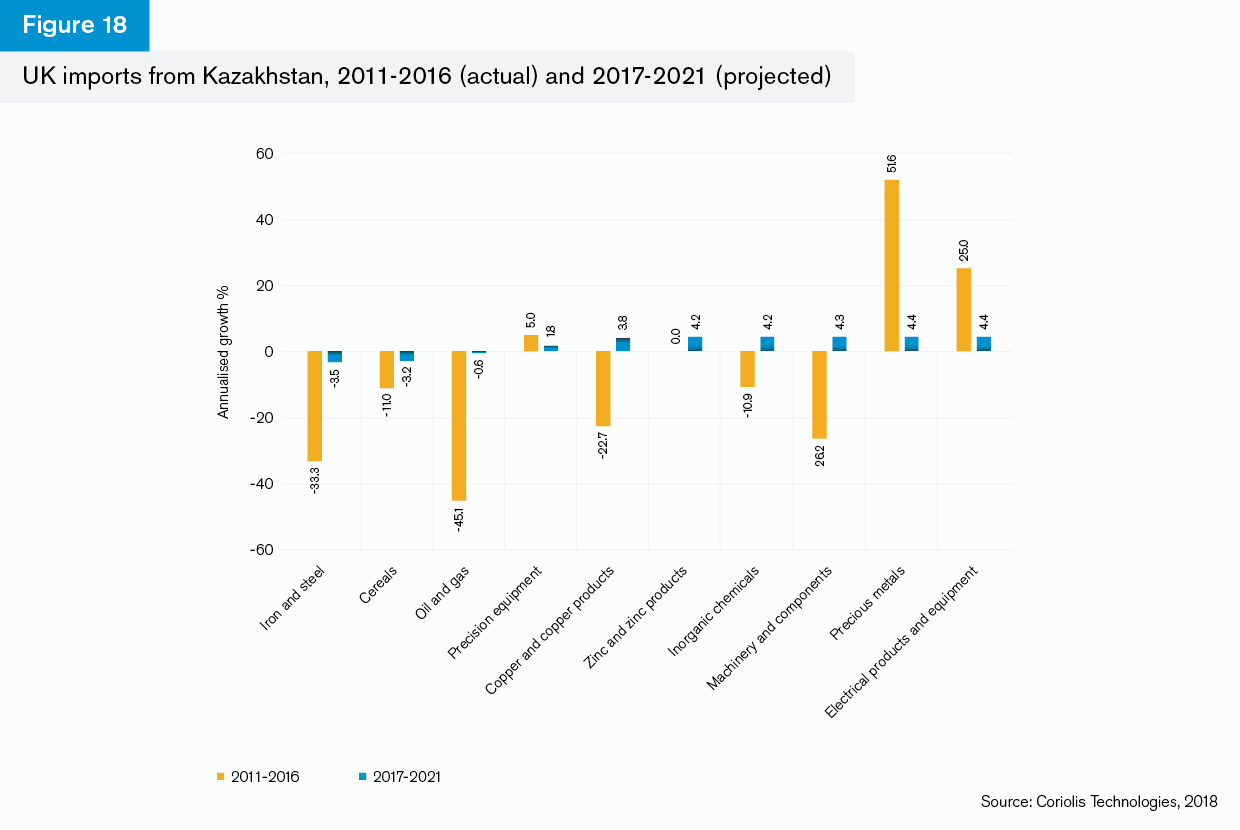
In a January 2017 speech to the UN Security Council, to which Kazakhstan was elected as a non-permanent member in 2016, Kazakh foreign minister, Kairat Abdrakhmanov, emphasised the country’s new strategy of conflict resolution through peaceful means, suggesting that its aerospace interests in trade terms will be around preventative security rather than active engagement.The UK currently has a trade deficit with Kazakhstan. In 2016 the UK imported nearly US$1bn of goods from the country, with precious stones and metals, copper, inorganic chemicals and oil and gas among the largest import sectors, and electronics both the largest and fastest-growing sector (Figure 18). The projected growth in imports is strongest in machinery and components, precious metals and electrical products and components.
UK services trade
It is a mistake to think that UK trade is all about goods. Some 43% of UK exports are in services. According to the UK government’s Pink Book, which is a compilation of data behind the UK’s balance of payments, UK service exports were worth approximately US$319bn in 2016 (using the annual average sterling-US dollar exchange rate for 2016).
The data presented in this section takes an average of OECD, Eurostat and UN data and mirrors trade with other countries in exactly the same way as the goods trade data is derived. This produces a more granular dataset and one that can be used to show patterns and trends across service sectors and trading partners.
This approach yields a value for UK service sector exports of US$332bn in 2016, compared to US$436bn in goods trade. The UK has a trade surplus in services and it is acknowledged that the service sector is more important as a driver of UK GDP growth than goods trade, which is a net pull on GDP (Figure 19).
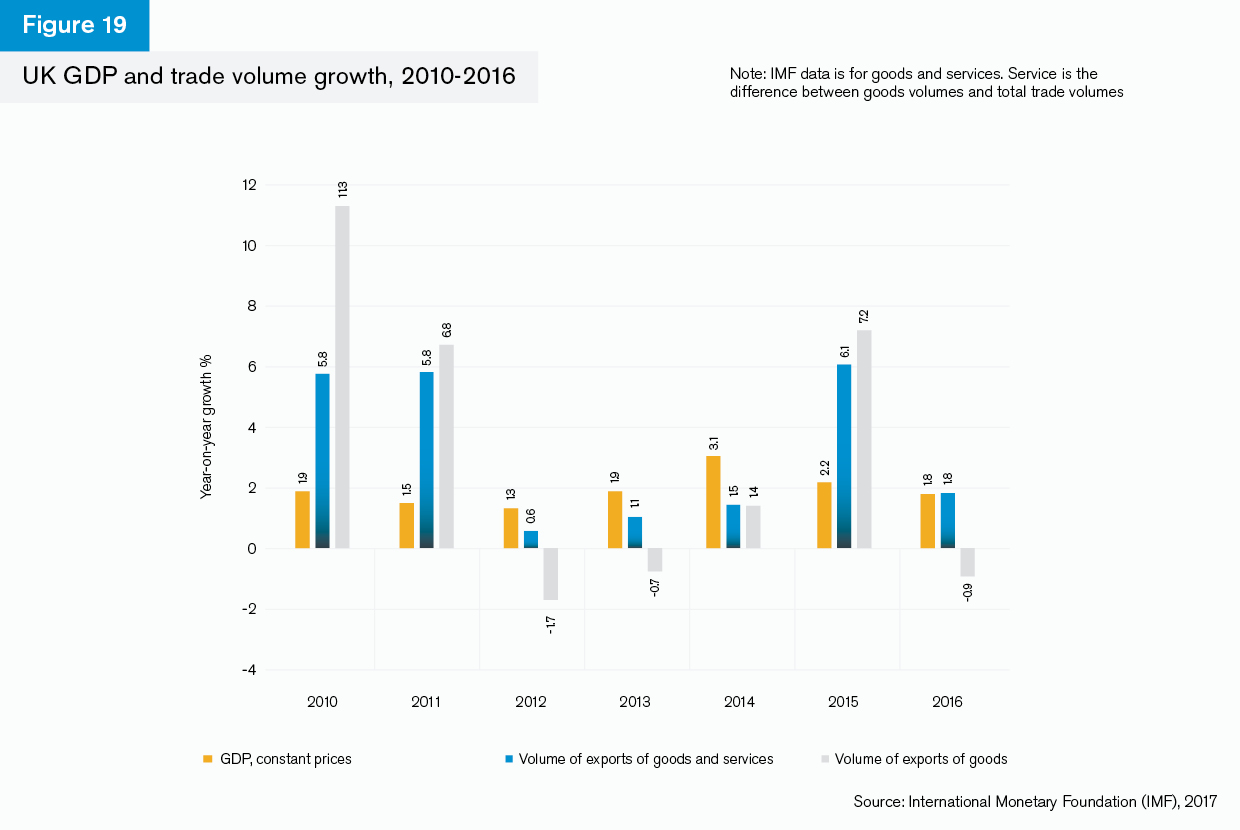
Historically, economists have assumed that goods export volume grows at roughly two times the rate of GDP growth at a global and a country level. This relationship at a global level has broken down over the years since the financial crisis and one of the reasons may be the increasing importance of services to the trade mix. The values and volumes of service trade are notoriously difficult to measure, since many of the transactions are electronic and do not necessarily require processing through customs and excise. Nevertheless, where services are regulated or reported in some way, as in financial services, intellectual property, construction or government services, there are metrics available.
The IMF estimates that in 2010 and 2011, years of rapid trade growth, both services and goods trade volume growth substantially outstripped the UK’s GDP growth. Much of this was post-financial crisis catch up, and between 2012 and 2014 the reverse was the case: trade volumes were lower than GDP growth. They picked up in 2015 but, while services exports remained at the level of GDP growth in 2016, the volume of goods exports fell back, meaning that, again, the average growth of the two was below that of GDP growth.
What Figure 19 shows clearly is that service trade volumes have been substantially more robust than goods trade volumes over the same period and, more importantly therefore, will pull positively on GDP in a more consistent way.
The trade surplus in services is driven primarily by financial services and other business services, which includes management consultancy, accounting and legal services (Figure 20). Insurance and pension services and intellectual property services are also surplus sectors.

Intellectual property charges includes patents, licenses and copyright as well as returns to R&D services. It is a surplus sector which suggests that the UK’s research and intellectual property has a strong market abroad.
Neither transport nor travel are surplus service sectors, although within each broad category there are sub-sectors which are in surplus. In 2016 the UK had a deficit, for example, in tourist-related travel of nearly US$18bn, but in air transport generally a surplus of US$4.5bn. In other words, the detailed picture is more complex and does not suggest that the UK’s trade surplus in services is at all uniform or consistent.
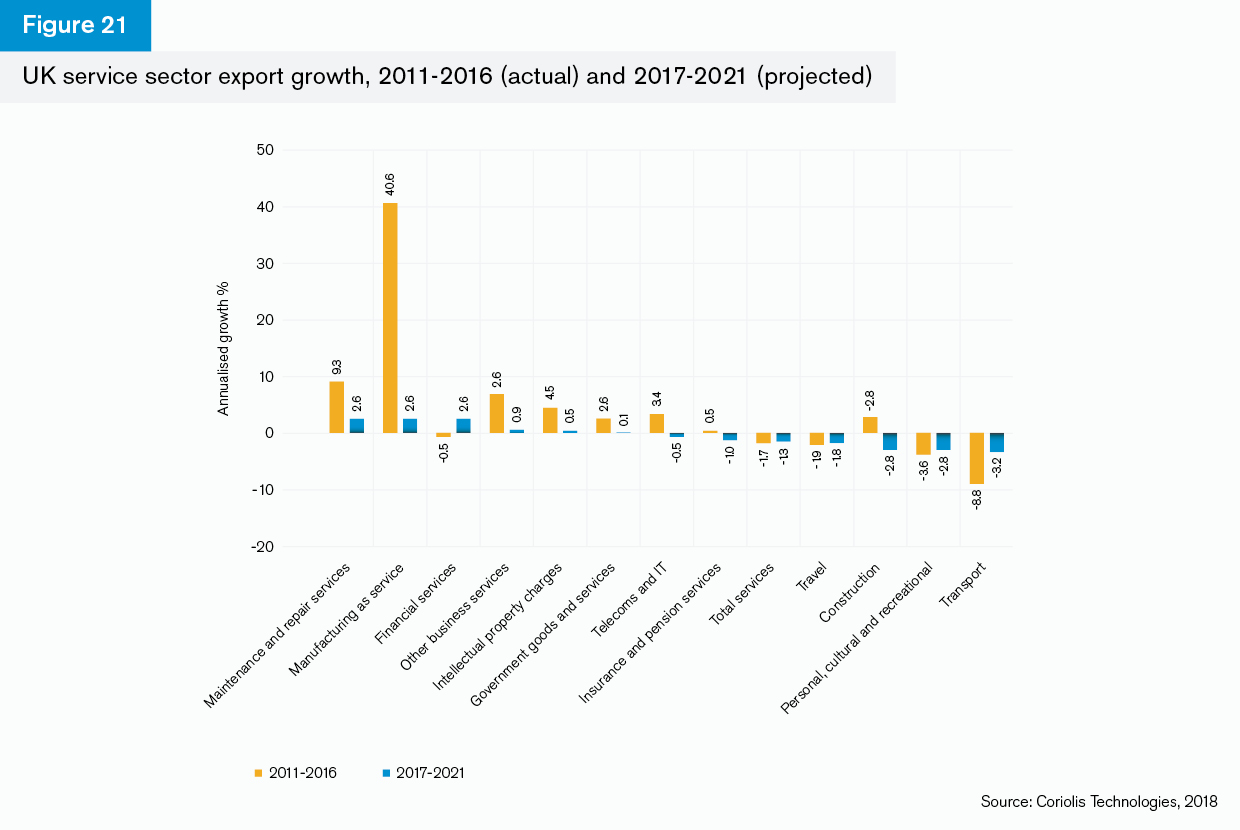
As with goods exports, however, there are signs that the UK’s service export position may be slowing over the projected period to 2021. Figure 21 highlights several things:
The rapid growth in maintenance and repair services and manufacturing as a service between 2011 and 2016: These are relatively new service sector classifications, and global data before 2010 is very patchy. The growth of both of these sectors, but particularly manufacturing as a service, is from a very low base – the sectors are not particularly large at present and their growth into the period 2017-21 suggests that they are stabilising rather than slowing down.
Financial services export growth fell back during the period 2011-2016. Some of this may be because of the aftermath of the financial crisis – the rapid growth in 2010 and 2011 was unsustainable as much of it was catching up from the contraction in 2009. However, changes in regulatory structures, tighter conditions against anti-money laundering (AML) and know your customer (KYC) after 2012 and lower levels of correspondent banking may also have contributed to this slow-down, as the largest financial institutions became more cautious about operating in international markets. The market looks like it will adjust with a projected growth of 2.6% annually to 2021.
Overall service sector exports have contracted over the 2011-2016 period and this looks set to continue. This may be because of heavier competition, particularly in sectors where the UK does not currently have a service trade surplus, such as travel and transport, but also in recreational and cultural activities.
The picture of slowing export growth beyond 2017 is evident at a service sub-sector level as well (Figure 22).
Once again, rapid growth in services post-financial crisis is highlighted in this chart. Legal, accounting and public relations services and professional and management consultancy are big sectors for the UK but even so their growth has been rapid. Growth in personal and educational travel, air transport (excluding passenger and freight) and R&D services was also strong.
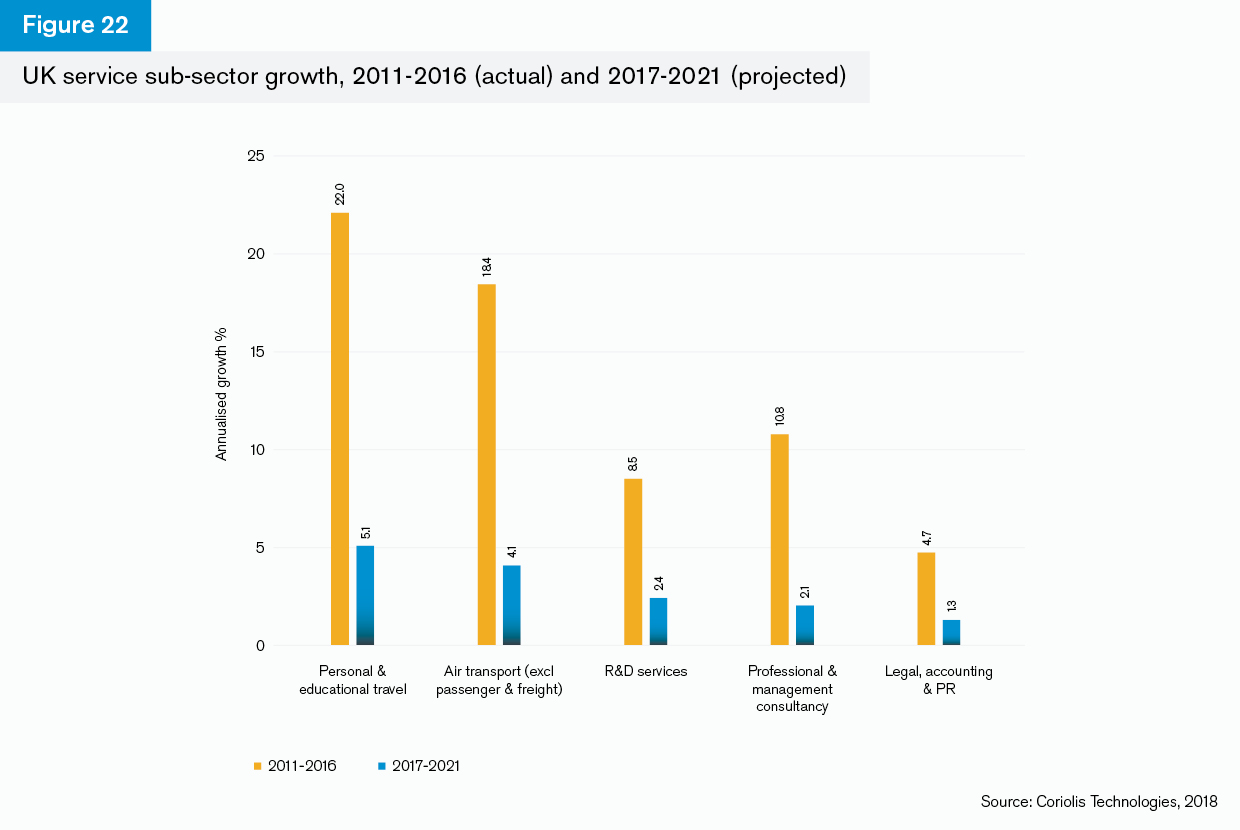
In a sense, this rapid growth in service sector exports over the past five years is simply a reflection of technological change and cheaper travel costs that have increasingly enabled service providers to operate internationally. The slowdown into the next time period may simply be a reflection of the market becoming both larger and more mature. This, however, does not mean that there is scope to be complacent. UK services exports are currently heavily reliant on Europe’s regulatory structures and issues of regulatory equivalence and passporting may constitute downside risks to the projections given here.
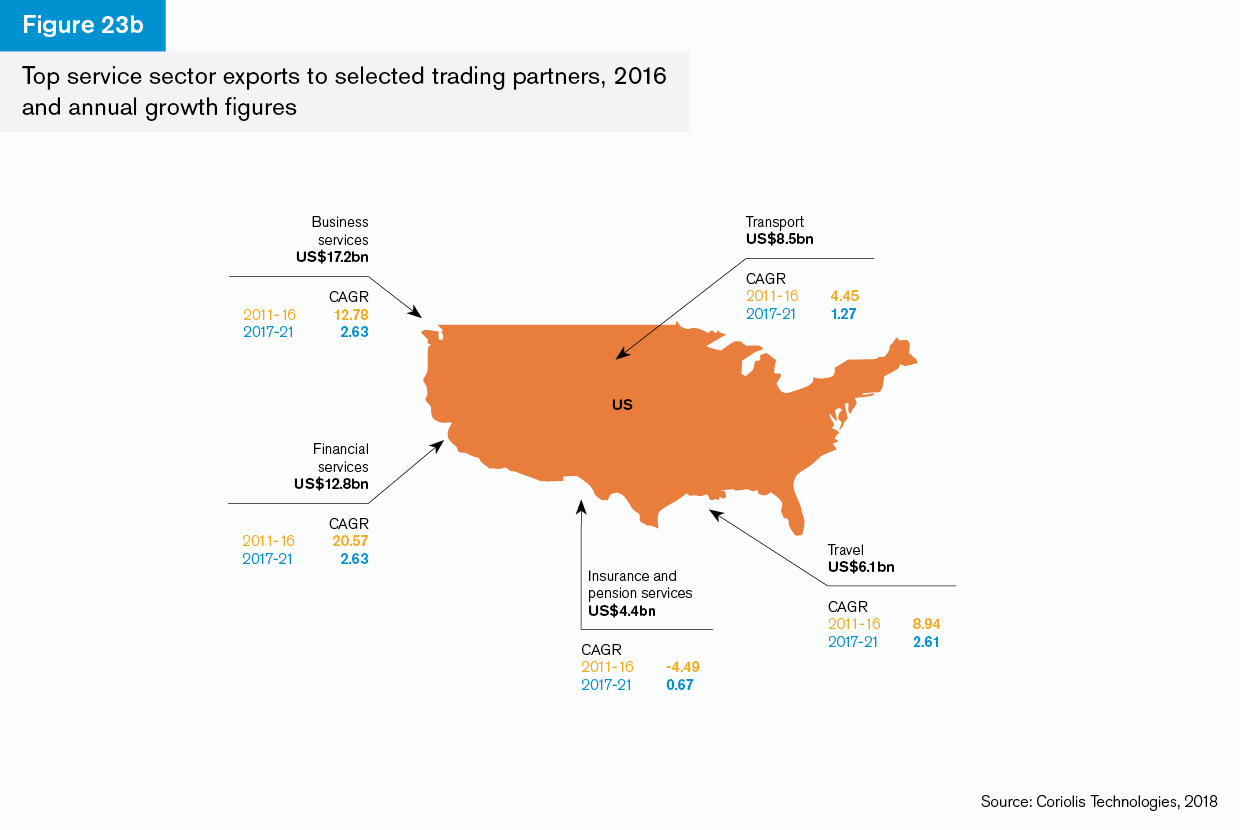
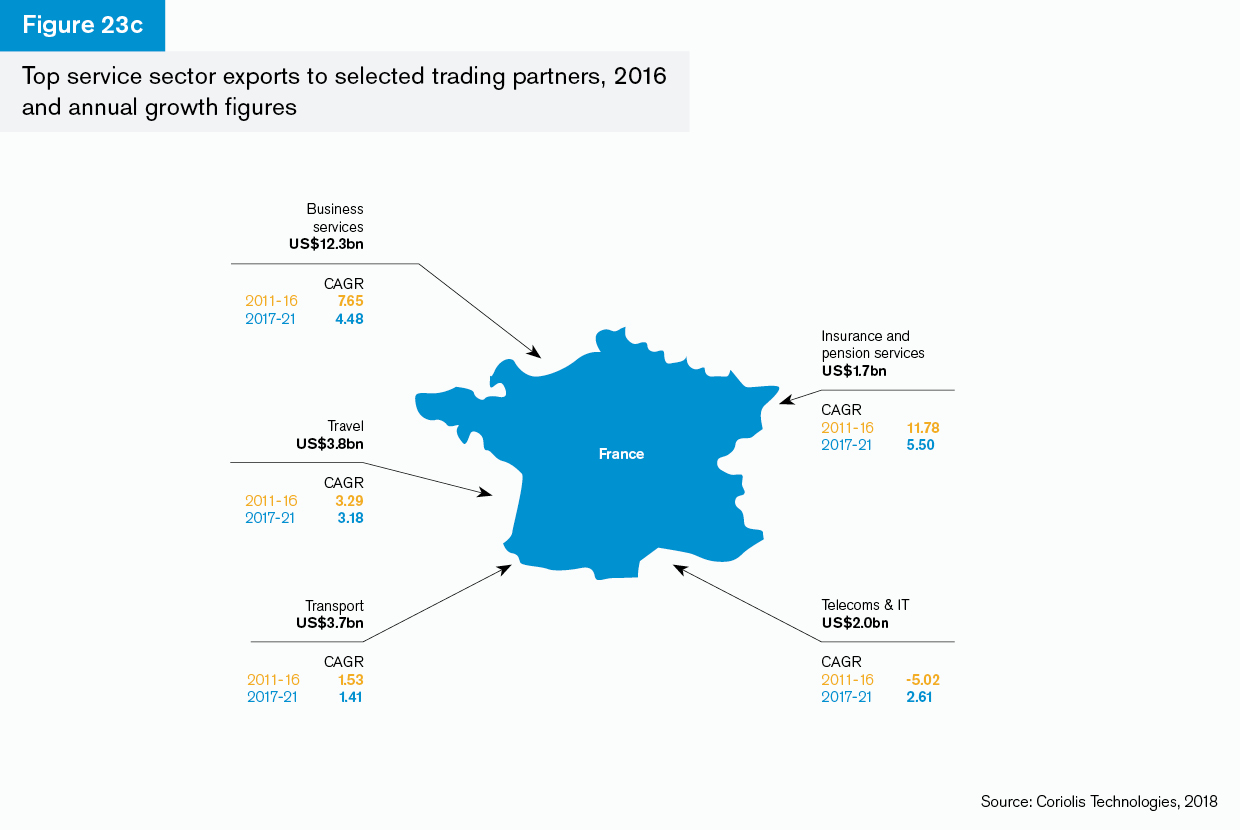
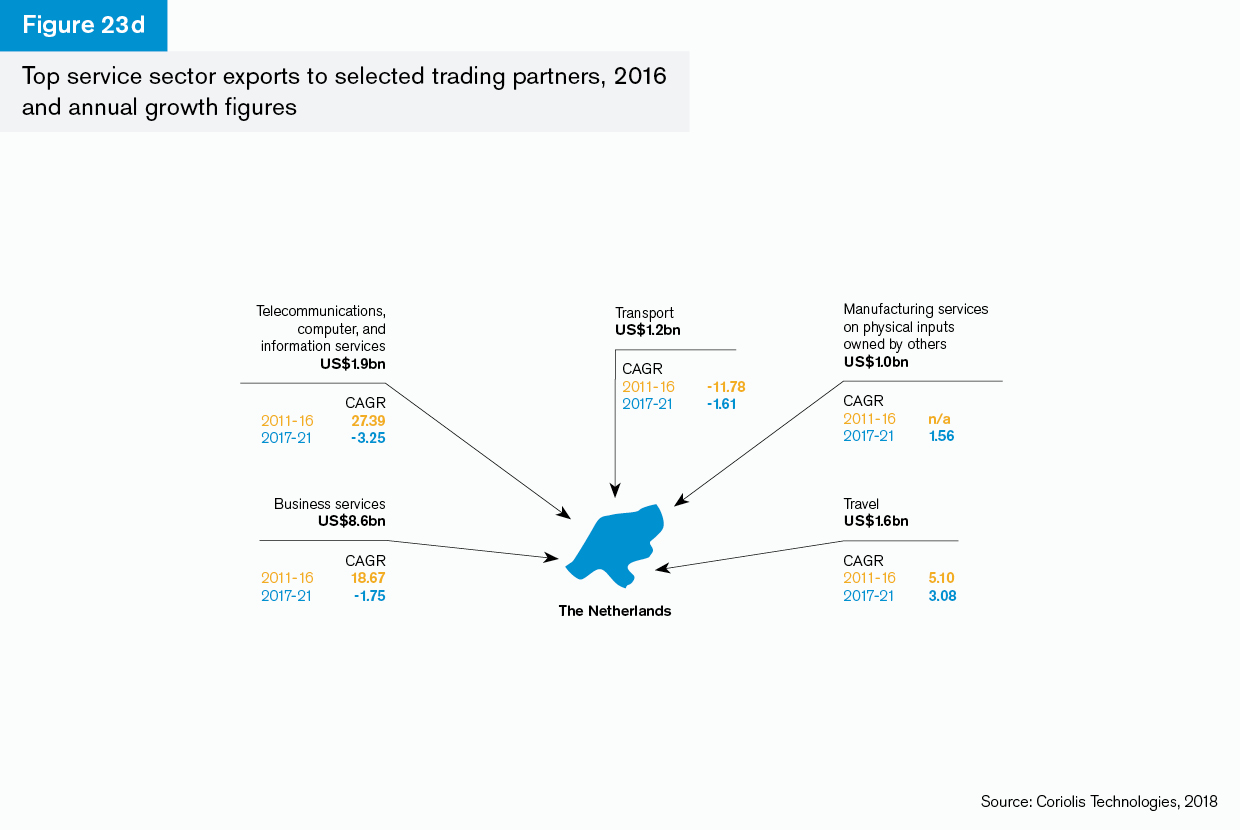
The pattern of slowing service sector trade growth is evident in our trade with partners as well (Figures 23a to 23e).
Germany
In 2016, the UK has a service sector trade surplus with Germany of approximately US$11bn and total exports of US$26.3bn. The UK’s services exports are dominated by business services (management consulting, accounting and legal services) which account for almost as much alone as the other top five sectors put together. Both business services and transport services export growth to Germany have declined over the past five years and are set to decline further, albeit at a slower rate. However, financial services and telecommunications and IT appear to be sectors that will increase strongly on an annualised basis in the period to 2021.

US
The US is the UK’s largest service sector export destination and the UK has a net surplus of around US$30bn and total exports in 2016 of US$90.2bn. Business services and financial services feature strongly and only insurance and pensions services have declined over the past five years. All of the UK’s service sectors with the US are set to increase over the next few years to 2021, with business services and financial services growing at an annualised rate of 2.6% over that period. Travel and transport are also set to grow, with travel growing at 2.6%.
France
France is the UK’s second-largest market for service sector exports, with a total export value of US$25.4bn in 2016. Business services dwarf all of the other service sectors at US$12.3bn. This is nearly half of the UK’s service sector exports to France and accounts for much of the total surplus of around US$3bn that the UK has with France. UK service sector exports to France are projected to grow substantially at an annualised rate for insurance and pension services of 5.5% and for business services of 4.5% to 2021.
The Netherlands
The Netherlands is a large service sector export destination for the UK, with a total value of exports of US$18.2bn for 2016. This is nearly twice the level that the UK imports from the Netherlands. Business services are the biggest single services export sector and grew rapidly between 2011 and 2016. However, the growth rate is projected to slow by nearly 2% on an annualised basis. Similarly, telecommunications and IT and transport export growth is projected to slow over the next time period. The data for manufacturing as a service is unreliable for the period 2011-2016, not least because this is a relatively new sector, but is predicted to grow by over 1.5% to 2021.
Republic of Ireland
The UK exported a total of US$13.9bn services overall to the Republic of Ireland in 2016 and imported just over US$7bn, so services exports are strongly in surplus. As with other countries, this is predominantly accounted for by business services, and the projection to 2021 for UK exports to the country is for growth of nearly 1.5% on an annualised basis. Sectors which will continue to contract in the future may include intellectual property and transport, although the rates of slow-down are less rapid than in the previous time period.

Focus on UK countries and SMEs
The countries within the UK have fared differently in export terms since the financial crisis. There are fewer international businesses, for example, in Wales, Scotland and Northern Ireland than there are in England and it stands to reason, therefore, that there will be substantially lower levels of exports from those countries but also, that any growth (or decline) will be accentuated.
This section is a short overview of the individual countries within the UK and of the sectoral picture for small and medium-sized enterprises (SMEs). This perspective rests on different data to that provided so far – the material is taken from UK Trade Info (which reports on customs and excise data) and from the Bureau van Dijk Orbis database (public and private companies across the world).
This is a summary to indicate where the growth potential by region and sector is for international business and trade finance within the UK.
Goods trade with the European Union is set to grow over the period to 2021 for Wales, Scotland and Northern Ireland, but not for England (Figure 24).
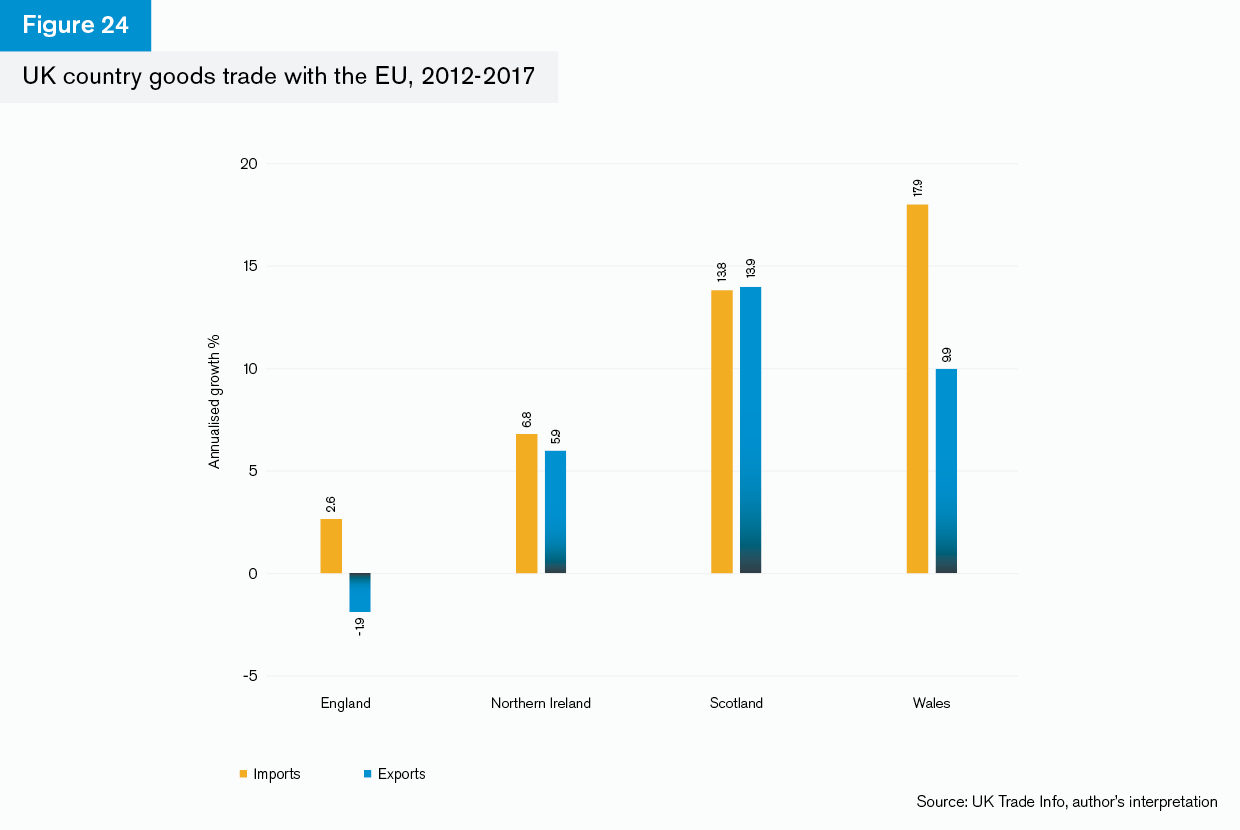
The growth period shows actual growth between 2012 to the end of Q3 2017 (with the final three months of data interpolated). Because the data originates from a different source used elsewhere in this Trade Briefing, no attempt has been made to project the time series into the future as the methodologies would be different and hence produce inconsistent results.
The chart shows, however, that Scotland, Wales and Northern Ireland have become more open economies over the past five years, in that both exports and imports have increased, while England has seen an increase in goods imports but a decrease in goods exports. This is broadly consistent with the narrative in previous sections but suggests that there are opportunities that are not just confined to London, as growth rates may be higher in other regions.
Interestingly, there has been growth in exports to non-EU countries for every UK country except Wales, although imports from non-EU countries have declined for England over the past five years (Figure 25).
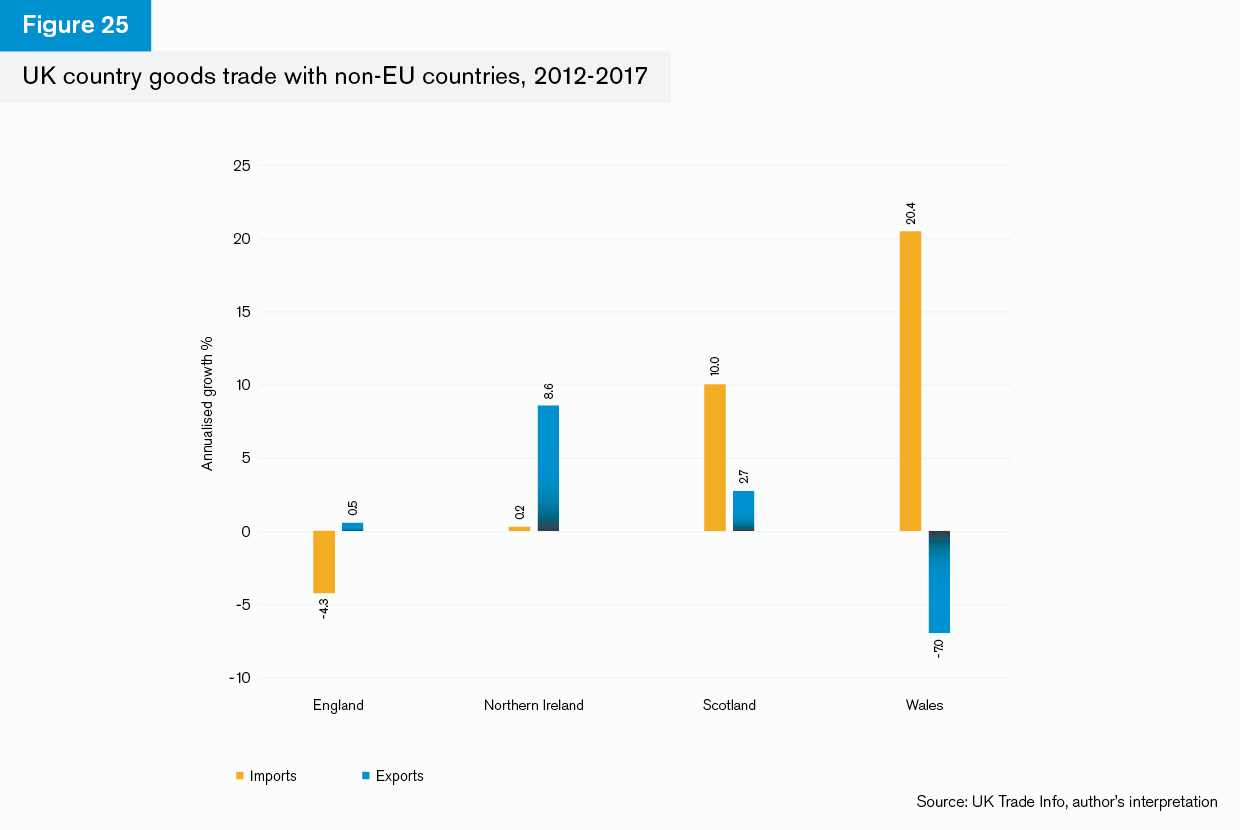
Once again, it’s clear that Scotland has become more open as a trading nation over the past five years. Import growth has been at an annualised rate of 10% from non-EU countries (suggesting this was from a relatively low base) and export growth has been around 2.7% a year from 2012. Northern Ireland’s export growth is nearly 9% on an annualised basis, but again this is from a relatively low base.
Scotland’s trade within the EU and outside of the EU is dominated by its oil and gas and beverages sectors, while for Northern Ireland, as is the case with England and Wales, vehicles trade dominates. Scotland’s growth in exports in 2017 can be accounted for by its trade with the US and the Netherlands, while Northern Ireland’s dominant partners in the same period were the Republic of Ireland and the US.
The sectoral pattern of trade within the SME sector reflects the pattern above: manufacturing is dominant and this includes pharmaceuticals and vehicle manufacture. Again, the sector definitions are different to those used elsewhere in this report, but the approach allows an understanding of the mix between services and goods trade as it is balanced throughout the SME group of companies.
Around 30% of the UK international business population, namely those companies with international sales, are SMEs. Although these companies won’t account for 30% of the UK’s trade value because their turnovers are, by definition, smaller, this is a high number of exporting companies. They are predominantly in manufacturing, although services also feature strongly (Figure 26).
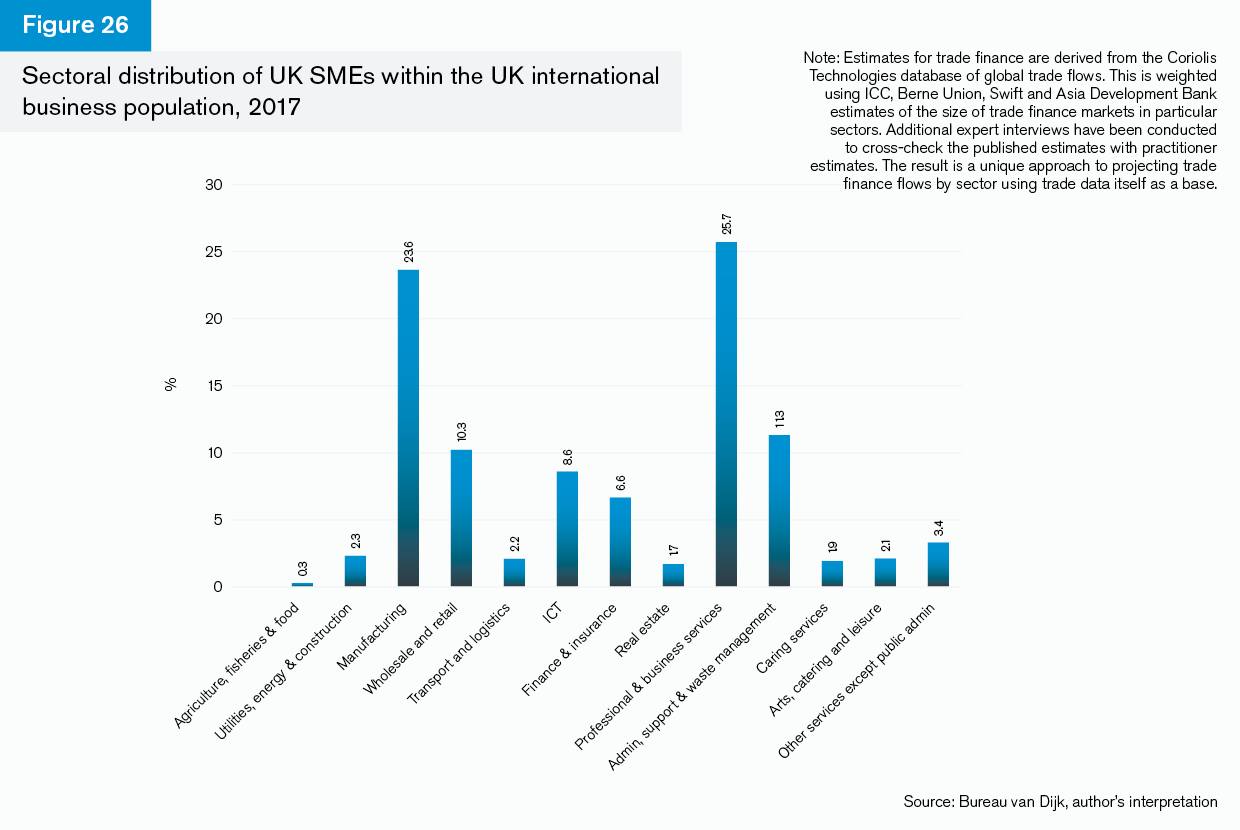
One important point that can be derived from this chart, which correlates with the main thread running through this report, is that the sectoral distribution of exporting SMEs is heavily biased towards services: business services, administration and support, finance and insurance and ICT together account for nearly twice the number of SMEs involved in manufacturing.
However, services, although growing, still only account for 43% of UK exports, while commodities, food, manufacturing and energy account for the rest. This suggests that more emphasis on growing exports in services amongst the SME community could ultimately provide a boost to UK trade.
Concluding remarks
This Trade Briefing has provided a summary of the UK’s trade profile for goods and services, including a brief look at the SME sector. Much of the material for services and companies is new, but points very clearly to the fact that services exports are an important contribution to UK GDP and hence need to be protected in any future arrangements with the EU and with partners outside of the EU.
The intention of the Trade Briefing was to provide an overview of the state of play of UK trade and a projection for the future if everything continues to remain aligned with current momentum. This highlights the key challenges for trade and trade finance practitioners: there is evidence in the date that UK trade growth in goods and services may fall back over the next few years.
At the very least this is a rallying call to trade finance providers to place renewed emphasis on supporting SMEs, prioritising key sectors in goods and services trade and focusing on markets where there are already strong relationships as well as building new ones.
The UK bank-intermediated trade finance market was estimated to be worth around US$267bn for UK exporters in 2016 (Figure 27). The numbers are derived from the proportion of total trade that is accounted for by trade finance generally and bank-intermediated trade finance in particular, according to the ICC Banking Commission. This represented a big decline on 2015 values and is a reflection of a sluggish market, tighter compliance regimes globally and weaker commodity prices since the end of 2013.

The priorities for the UK now are to ensure that the downside risks of Brexit, economic slowdown and general trade uncertainty amongst the business community in the UK do not materialise. The data presented in this report already shows that trade growth may slow or turn negative based on current patterns, without taking any of these risks into account. This serves as a wake-up call to everyone in the sector that trade growth should now become a practical priority.
Methodology
Overview
Coriolis Technologies provides datasets of global trade flows covering the time period 1996 to 2020, with annual and monthly data from January 1996 to the current month. The data cover import and export flows for 200 countries by partner, sector and partner-sector trade routes. The goods dataset uses OECD mirroring techniques to ensure that bilateral trade flows are identical. For example, exports of oil from Saudi Arabia to Germany will have the same value as imports of oil into Germany from Saudi Arabia.
Data refinement methodology
Coriolis Technologies uses the UN Comtrade statistics as the main source of comprehensive and detailed information on international trade. The UN Comtrade’s database provides information as it is reported by country authorities and does not apply any data integrity verification or missed data filling. Consequently, the raw UN Comtrade dataset presents the following relevant issues:
- Absent or sparsely reported data for many countries and territories, especially in Africa, Asia and Latin America
- Large asymmetries in bilateral trade values reported by a pair of countries
- Partly disclosed information due to statistical confidentiality (relevant especially to the arms trade and sanctions regimes)
- Classification reporting and conversion issues (UN Comtrade does the conversion between different classifications, based on the most detailed layer of the classification, while some information can only be reported on an aggregated level)
- Delayed reporting and past information amendments by some countries
In order to build consistent international trade data and increase its coverage on the bilateral level to the extent possible, Coriolis Technologies shares the trade mirroring approach used, in particular, by the OECD.
This approach uses the information reported by partner countries to resemble and verify the reporter’s data as well as to fix the asymmetries. Mirror statistics are mostly helpful for small and medium-sized trading countries, where there is no reported data available or the data is very sparse. However, in many cases they help to reveal some systematic trade underestimation for some well-established reporters, or information which was not disclosed.
Coriolis Technologies implemented the trade mirroring algorithm for the UN Comtrade Harmonised System (HS) classification, revision 1996, as follows:
- Trade mirroring applied for each trade flows between all the reporting countries and territories.
- Simple trade mirroring is done for cases when the trade is reported only from one of the sides.
- When a trade is reported by both sides and there is an asymmetry, the common trade value is calculated as a weighted average of the two reported values. The weights are defined in accordance with the country reporting reliability index, developed by Coriolis Technologies.
- If the asymmetry is extremely high, the lower value is assumed to be underreported, and the resulting trade value is set to the higher declared figure.
- The resulting trade values on 2 and 4-digit levels, calculated for the HS 1996 classification are compared with those for HS classification used when reporting (normally country statistic offices report in the most recent classification for the year, and this information is converted to previous versions of HS classifications with certain losses, related to detailed data disclosure). If the difference between the trade value in HS 1996 and HS ‘as reported’ is higher than 40%, the former is assumed to be wrong and the HS ‘as reported’ value is taken as the best estimate.
- When the whole dataset is processed for a single year, country total imports and exports are calculated for the refined trade values for each commodity group, and the total cumulative import and export values are obtained for each country and the world.
The resulting ‘refined’ dataset appears to be the most complete of the available source data, and features the following attributes:
- Provides best available estimates of aggregated trade statistics, where they were not reported or significantly distorted
- Gives an indication of hidden trade flows and the true state of trade relationships, when the ‘refined’ values diverge significantly from the ‘raw’ figures. The amount of hidden trade can be estimated as the difference between the two on a commodity or aggregate levels.
- Is import/export consistent: each country import value is equal to the counterparty’s export value for every commodity group/classification code, and the global import total converges with the export total.
Trade forecast methodology
Coriolis Technologies employs a momentum-based forecasting algorithm in order to produce trade value forecasts. The method below is generic as applied to a longer time period. However, for this report we have limited our forecasts to the end of 2017.
The forecasting method features the following concepts:
- Analyses dynamics of differentiated time series with 10-year historical horizon, applies outliers filtering and absent data filling.
- A double momentum forecast: the first taking a 10-year moving window and the second a three-year moving window. The former provides long-term stability to the five, 10 and 15-year forecast, while the later impacts the one to three-year dynamics of the forecasted time-series.
- A constant growth rate of 1.0% (continuous compounding) is applied to extremely volatile and/or highly fragmented time series.
- Shares the Gaussian approach in order to provide long-term forecast, given the growing degree of uncertainty.
The forecasting algorithm, if extreme volatility or incomplete data identified, takes the average of the last three years (2012-2014) as the starting level, and then calculates the forecast based on the 1% annual growth rate on the logarithmic scale (1% log return).
This is based on the assumption that if the data is not reliable, the last three-year estimate is a far more legitimate predictor of the 2015 ground level.
The model does not rely on any assumptions about the economic cycle or supply chains and is built purely on the drivers of trade in the data (identified through Principle Component Analysis) and the data’s momentum. This approach is chosen in preference to bilateral trade modelling such as gravity modelling or partial equilibria for two reasons: first, it does not require normative assumptions about trade costs or geography and second, it does not require assumptions about GDP growth to be made. The relative simplicity of the model provides an important balance between flexibility and reliability of the forecasting algorithm, especially in the short term.