Rebecca Harding, CEO of Coriolis Technologies, discusses Asia’s trade performance and its projected growth in the context of factors such as Covid-19 and the US-China trade war.
GTR: What impact will China’s recovery from the Covid-19 pandemic have on trade for countries across the Asia Pacific (Apac) region?
Harding: China’s role in the global economic recovery cannot be understated, so it stands to reason that it will also play a significant role in the rate at which the region recovers in trade terms. This sounds like a truism, but because of the complexity of the way in which trade has developed through the Covid-19 pandemic, China’s importance is now not just an economic one, it is a strategic one as well.
At the beginning of 2020, there was considerable optimism about the prospects for world trade. A modest trade deal had been signed between the US and China, and the global economy appeared to be heading towards a resumption of growth as the uncertainties around the US-China trade war eased. The sustained threat of tariffs through 2019 meant that supply chains had the potential to be diverted away from China in particular towards other regional economies like Vietnam, and trade finance professionals were, informally at least, reporting a very good 2019 as a result.
As the Covid-19 pandemic took hold of China in January 2020, factories closed, inventories fell and supply chains around the world began to stall. The whole world realised the interdependency of global trade. But rather than promoting multilateralism, the consequence has been an increase in the use of nationalistic rhetoric and, at the time of writing, some 934 protectionist measures across the world have been imposed according to the Global Trade Alert.1
Most worryingly of all, the US has blamed China for the spread of the virus and threatened to use trade measures such as tariffs as a mitigant for the “plague” it imposed on the world.2 In the past few months, restrictions have been imposed on US companies using Chinese technology, particularly in the 5G space such as Huawei, and for Chinese companies using US technology in delivering services anywhere around the world.3 The US has threatened to restrict Chinese companies’ access to US dollar-based markets and trade,4 and to renege on US Treasury debts to China by way of retaliation for what it sees as a lack of transparency on China’s behalf at the beginning of the crisis.5 Whatever the rights and wrongs of this argument are, China’s role everywhere has become more pivotal to both global and regional recovery and to the form that the recovery takes. Changes in the way the world finances and delivers trade with new digital technologies and more distributed supply chains will be the enduring consequence of this crisis.6
The World Trade Organization (WTO) will not be supported by the US without major reform and effectively this means that the role of China within the WTO will have to be rebalanced if it stands any chance of resuming any authority that it has had.7
Within the Asia Pacific region, China is the largest trading nation by some distance (Figure 1).

China is the top trade partner for imports and exports for most of the largest trading nations in the Apac region. The only exceptions are India, where China is the third-largest trade partner, and Singapore, where it is the second (Hong Kong is the largest). Its role within the region is therefore of paramount importance.
For China itself, nine out of its top 20 import partners and 10 out of its top 20 export partners are from within the region (Figures 2 and 3).
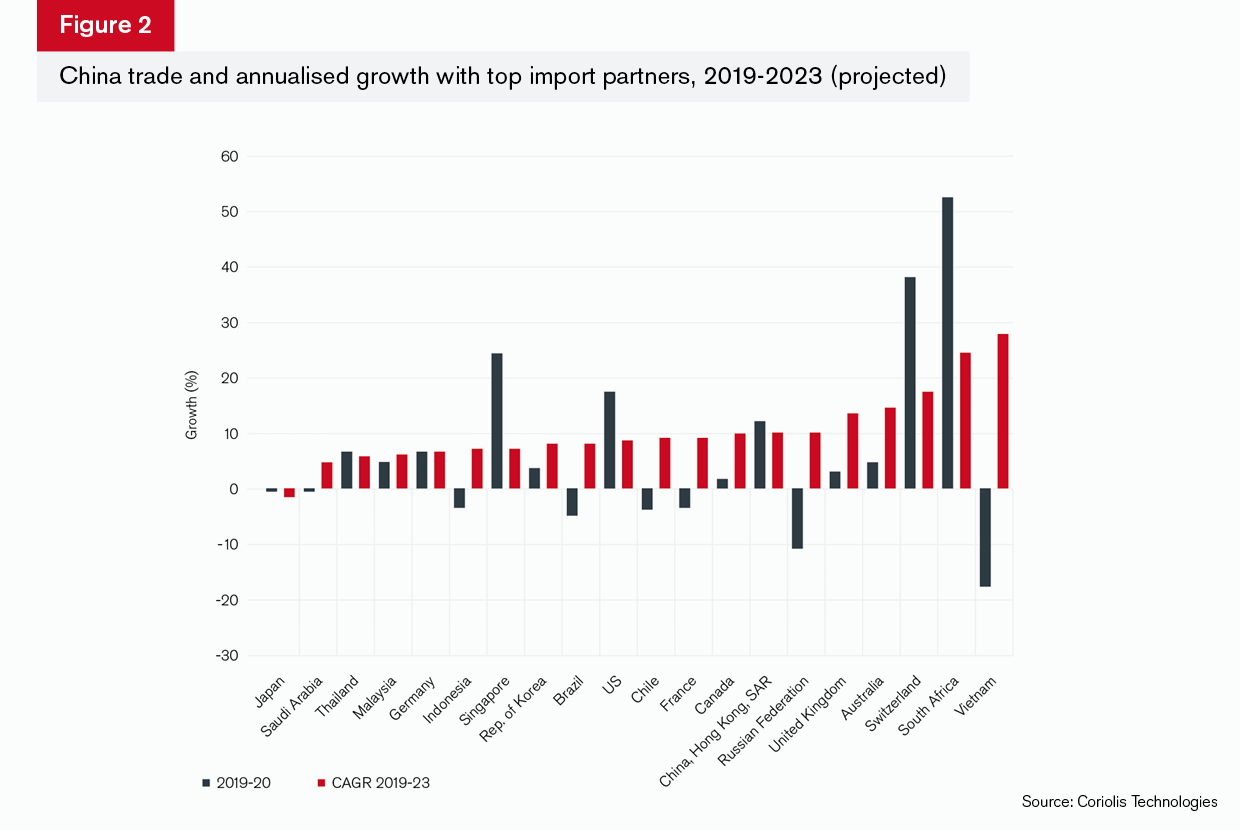

In terms of imports, there are a few highlights from Figure 2: Vietnam’s imports into China are likely to struggle during the pandemic, but are forecast to rebound substantially over the next five years at an annualised rate of growth of 27.7% to 2023. This is from a relatively low base compared, say, to the US or Switzerland, which are much larger trading partners. However, this does suggest that China has become increasingly reliant on imports from Vietnam, particularly in the electronics sector, which grew at an annualised rate of over 45% in the three years to 2018.
Australia’s trade is likely to grow during the course of 2019-20, which appears incongruous in the face of the current spat between the two countries over Australia’s support for an independent inquiry into the World Health Organization’s (WHO) approach to China during the early stages of the pandemic. China has launched an anti-dumping investigation into Australia’s support to its wine industry,8 but while this has provoked the Australian government into accusations of coercion and prompted China into rhetorical retaliation,9 these measures at present seem unlikely to lead to a longer-term impact on the trade relationship between the two. China relies heavily on Australian coal, for example, and current projections suggest that imports from Australia are likely to grow at an annualised rate of over 14% to 2023.
The picture is similar in terms of exports (Figure 3), with countries in the region some of the fastest growing export destinations for Chinese goods:
Vietnam will become increasingly attractive during 2020 with projected trade growth with China of 14.6%. This is below the recent trend of annualised growth to 2019 of nearly 24%, but is still significant given the current global economic situation. Again, it is electronics that are driving this expansion and again this is from a relatively low base, but it does corroborate the impression that the supply chain relationships between the two countries are strengthening.
China’s exports to Thailand will decline by over 14% during 2020, but will recover almost as quickly as its exports to Vietnam, at an annualised rate of growth of 15.3% to 2023. Thailand is a smaller export destination at some US$48.5bn a year and although electronics are the largest import and export sector, China’s exports to Thailand have a greater engineering focus, with the second-largest sector being machinery and components and the third and fourth being iron and steel, and iron and steel products. This suggests more of an investment from China in the country’s infrastructure.
China’s exports to Malaysia and Indonesia will drop by 2.7% and 6.6% respectively during the course of 2020, but recover to over 13% to 2023 in both countries. Exports to Malaysia in 2019 were worth US$47bn and highly concentrated in electronics, while exports to Indonesia in 2019 were worth US$45bn, with machinery and components the largest sector. This suggests that China’s role in these countries is in the supply of intermediate equipment as well as computing and electronics.
Whatever happens to China will inevitably have an impact on the region as a whole. Intra-regional trade across the world is growing as supply chains become more distributed and reliance on one supplier globally is reduced. This is a pattern that has been evident for some time but is particularly marked in the Apac region. As Figure 4 shows, intra-regional trade grew by 7.1% over the three years to the end of 2018, while extra-regional trade over the same period grew by just 3.8%. This trend is set to continue: the projected annualised growth for intra-regional trade between 2019 and 2023 is 4.3%, compared to 3.1% for extra-regional trade.

Care should be taken in this analysis of course. Intra-regional trade in the Apac region is worth nearly US$2tn, while extra-regional trade is worth over double that, at US$5.5tn. The slower rate of growth may simply be a feature of the sheer difference in volumes. However, the sectors that trade across the region suggest a high degree of inter-dependency for electronics and infrastructure supply chains.
With Apac’s trade growth so inexorably linked to that of China, the question then becomes: is China growing? At the time of writing (September 2020), there is evidence that China’s initial recovery from the impact of Covid-19 is decelerating. While trade appears to have picked up, imports in particular are slowing and, taken as a whole, its economic indicators appear to suggest that activity is at 80% of pre-pandemic levels.10 Contributing to this slowdown are the sustained tensions with the US, which will continue to affect investment levels, consumer demand and, most importantly, how technological relationships develop between east and west in the coming months and years.11
This may yet have positive consequences for the Apac region as a whole, although there are obvious tensions in the relationships and strategies between its competing geopolitical interests: Australia, New Zealand, Japan and South Korea, who align directly with the US; Hong Kong, which must now consider itself part of China; and between China and Asean nations, especially in the South China Sea. Trade is fragile because of the pandemic’s impact; the risk is that foreign policy tensions are manifested as a more weaponised approach to trade which is in the interests of no-one.
GTR: Which sectors in the region are likely to be most affected by the Covid-19 pandemic? Are there any that may become stronger?
Harding: There are few precedents upon which to base a forecast for trade. That said, the simultaneous collapse in oil prices, equity markets and global trade through Covid-19 are redolent of the 2008/09 global financial crisis. Therefore, the Coriolis Technologies forecasting methodology uses the patterns of that crisis and its impact on trade and applies them to the underlying momentum of global and regional trade growth over the past 12 years. According to this approach, few sectors within the region look as if they will be severely disadvantaged by the Covid-19 pandemic.
This approach potentially gives a more positive outlook to the Apac region than for other regions in the world, both immediately between 2019 and 2020 and over the longer term in terms of annualised growth between 2019 and 2023. This is because trade growth during the global financial crisis was particularly strong in Apac as trade finance resources were diverted from countries affected by the credit crunch to countries such as China and India, which were less integrated into the global credit system. It was during that period between 2010 and 2013 when south-south growth was rising rapidly that debate began in earnest about the so-called “New Silk Road” and the global north being challenged by the south.12
While such an approach may overestimate the effects of the Covid-19 crisis on trade in the region in the short term, it is unlikely to overestimate it over a longer period of time. This is because of two things:
- Trade within the region has been growing particularly quickly since 2014. This marks the beginning of the impact of Chinese Belt and Road Initiative (BRI) investment and China’s strategy to move to a consumer demand-led middle-income economy and away from the export-led growth that it had pursued up until Xi Jinping’s accession to the presidency in 2012.
- Geopolitical tensions, and in particular the trade war between the US and China, are separating out the east and the west, and have the potential in the coming years to decouple technological development, financial systems and trade. These pressures are already evident, but the likely outcome will be greater trade between non-US aligned countries in the region and China, all of which are more dependent on intra-regional trade than extra-regional trade.
For this reason, and to maintain consistency across Coriolis Technologies’ forecasting, no adaptation has been made to the underlying models.
Bearing this in mind, Figure 5 illustrates the impact upon sectors traded within the region. Unsurprisingly, it shows a decline in trade in oil and gas, copper, iron and steel, and organic and inorganic chemicals. Oil and gas have been affected by a collapse in oil prices globally, while the other sectors are associated with infrastructure and construction, which have been impacted by the current crisis and could struggle to recover in the future. Similarly, the electrical products and equipment sector, which includes computers, could experience a slight drop in trade – perhaps from the impact of restrictions placed on electrical equipment using Chinese technologies.
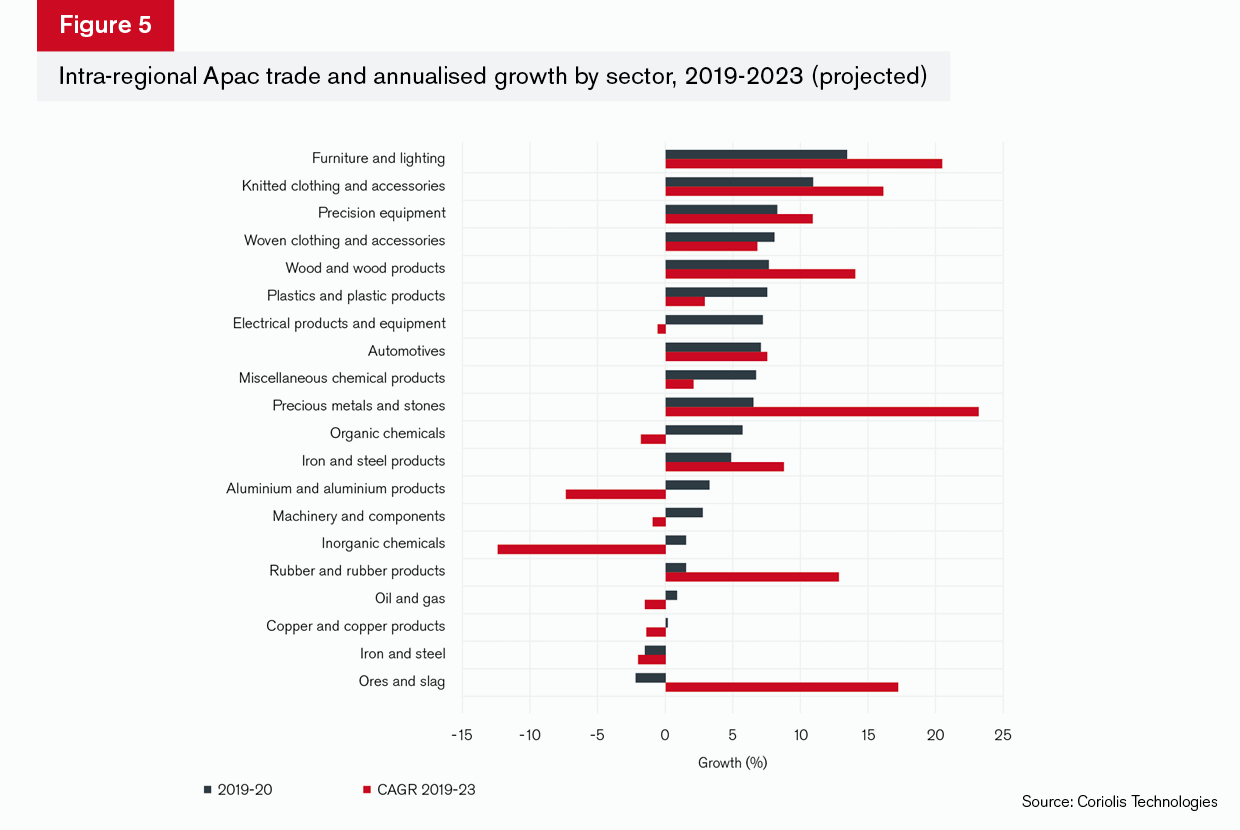
However, other sectors appear strong despite the collapse in world trade generally as a result of the pandemic. This is because China remains the workshop of the world, its trade is recovering even if it is still lower than pre-pandemic levels, and many of its supply chains rely on intra-regional trade.
For example, intra-regional trade in precision equipment and plastics – which include medical equipment and components for personal protective equipment (PPE) – is likely to grow substantially this year. The reasons for this are obvious: the pandemic is fuelling demand for many of the products of the region’s supply chains. Japan, South Korea and China are major manufacturers of ventilators and medical equipment and rely on precision equipment supplies from countries across the region.13 Ironically, these are frequently subsidiaries of US-owned businesses, but this nevertheless is fuelling intra-regional trade growth.
Extra-regional export growth highlights the importance of precious metals and stones in particular (Figure 6): Exports of precious metals and stones are set to grow by 43% this year. This sector includes gold and diamonds and its growth suggests two things: first, that sectors such as electrical products and equipment, which use manufacturing-grade gold and diamonds in their production processes, will not be affected too badly and, second, that gold itself is being used as a hedge against a more general economic downturn and volatility in financial markets.
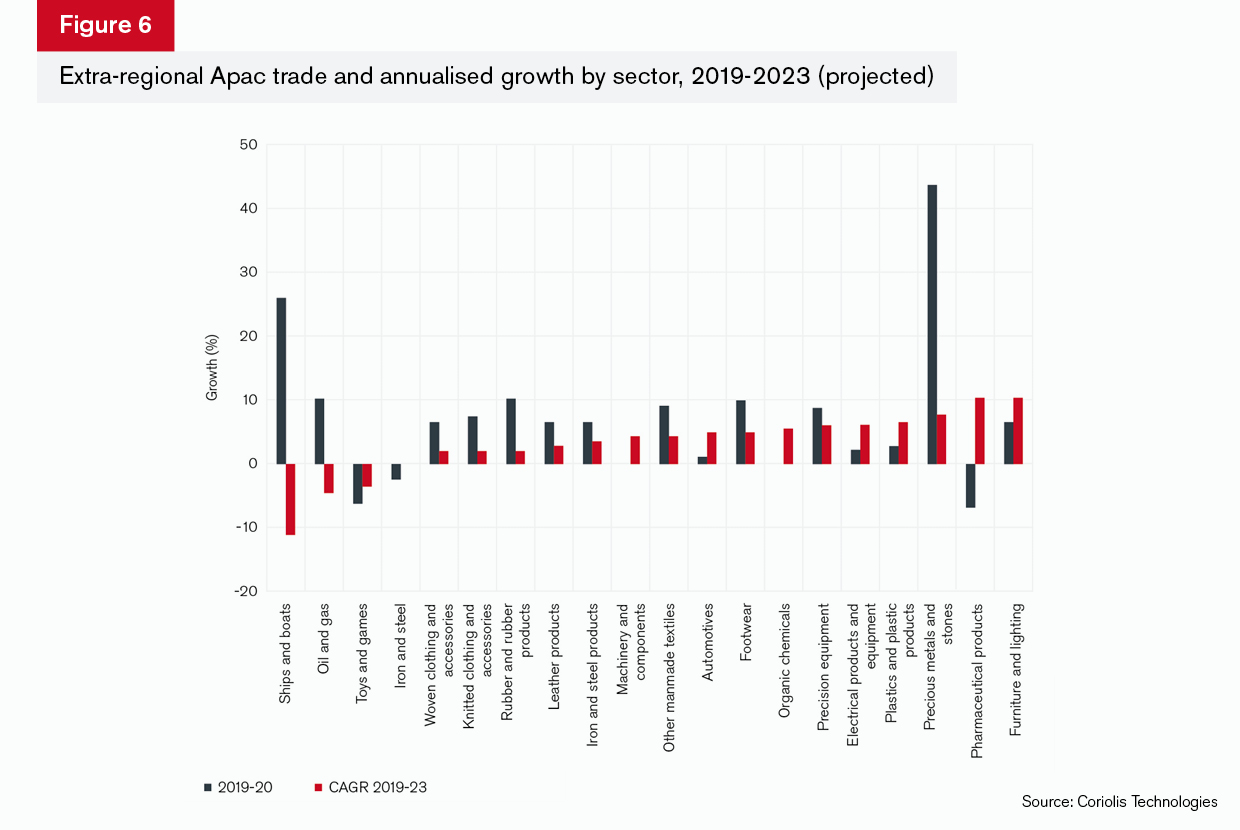
Exports of precision equipment are set to grow at over 8% this year despite export restrictions surrounding medical equipment as a result of the Covid-19 pandemic in 95 countries around the world.14 Pharmaceutical exports will decline during 2020 – this can be explained in terms of a general increase in trade restrictions on the exports of medical products across the world and in the region particularly. Growth in subsequent years will be significant however, and this arguably reflects the growing importance of China in this sector as a result of the Made in China 2025 programme.
GTR: Is it possible to separate out the effects of Covid-19 and the effects of the US-China trade conflict?
Harding: Covid-19 and the US-China conflict pose different disruptive influences on the region. Covid-19, for example, caused manufacturing to reduce in all except essential areas because of lockdowns. The consequence of this was inventory stock-outs, which caused supply chain shortages. This in itself has disrupted world trade and the potential for loss of demand globally from increased unemployment and economic downturn may cause flatter trade in the future.
Alongside this, the effects of the US-China trade war are already evident in the way in which intra-regional trade has grown over the past few years and, more than this, in the general nervousness around investment flows, which are expected to drop globally in 2020 by US$1.5tn.15 Even so, inward investment in China during 2019 appeared unaffected and actually grew by 10% for the emerging economies in Asia, which was a reversal of the drop in 2018. 16 Therefore, while it is difficult to separate out the effects, there is sufficient trade data available for the period since the onset of Covid to give an estimation of the difference (Figure 7).
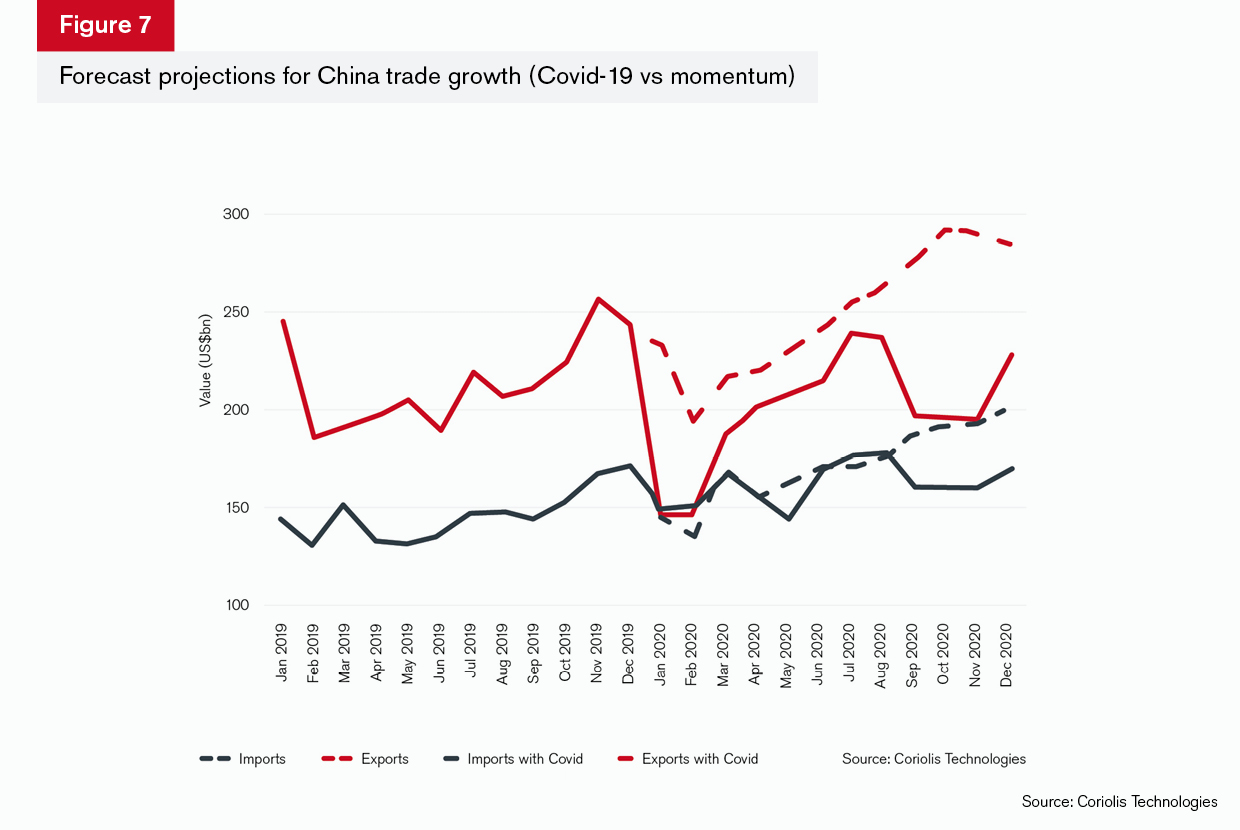
The chart presents two pictures of Chinese trade based on Coriolis modelling. The black lines represent imports and the red lines represent exports. The dotted lines on both are the momentum forecasts – in other words, what was projected to happen had Covid-19 not created the crisis it has. These show that trade, after a drop in January and February, would recover and post growth over the whole 12 months to the end of 2020.
The solid lines represent the actual data from monthly bill of lading data and Chinese national statistics for imports and exports up to August 2020. This shows the impact of Covid-19, the extent of recovery, and the projection to the end of 2020 based on the actual data.
The result is that the added effects of the Covid-19 pandemic are likely to reduce Chinese exports by approximately US$56bn and Chinese imports by approximately US$33bn.
In reality, the effects will be mutually reinforcing and extend over the years to come rather than the months to come. There is still huge uncertainty: we do not know if or how the US relationship with China will change should Joe Biden be elected US president in November, nor do we know how President Trump’s policy will develop if he enters a second term in office. Similarly, we do not know the extent to which further lockdowns will be enforced over the coming months.
GTR: What has been the impact of the US-China trade war on the Asia Pacific region?
Harding: Everything covered so far suggests that the direct influence of the US-China trade war across the region and on Chinese trade, is limited. Even a country like Australia, which is being more strident in its criticisms of China than other regimes in the region, is unlikely to see any long-term big drop in its trade as a result of any increase in tensions. In fact, it looks like contested sectors, like Australian exports of beef and beverages may actually continue to grow in the coming years, while imports into Australia from China are set only to fall back in toys and games and footwear. This could be as much a function of redistribution within Asia of production as a reduced reliance on China. Even electrical goods and equipment, which include data storage and processing hardware, is set to grow by nearly 3% annually.
In terms of the external trade of the Asean region within Asia Pacific, there is similarly no evidence that trade will decline as a result of the US-China trade conflict, which suggests little spillover to the rest of the region (Figure 8).
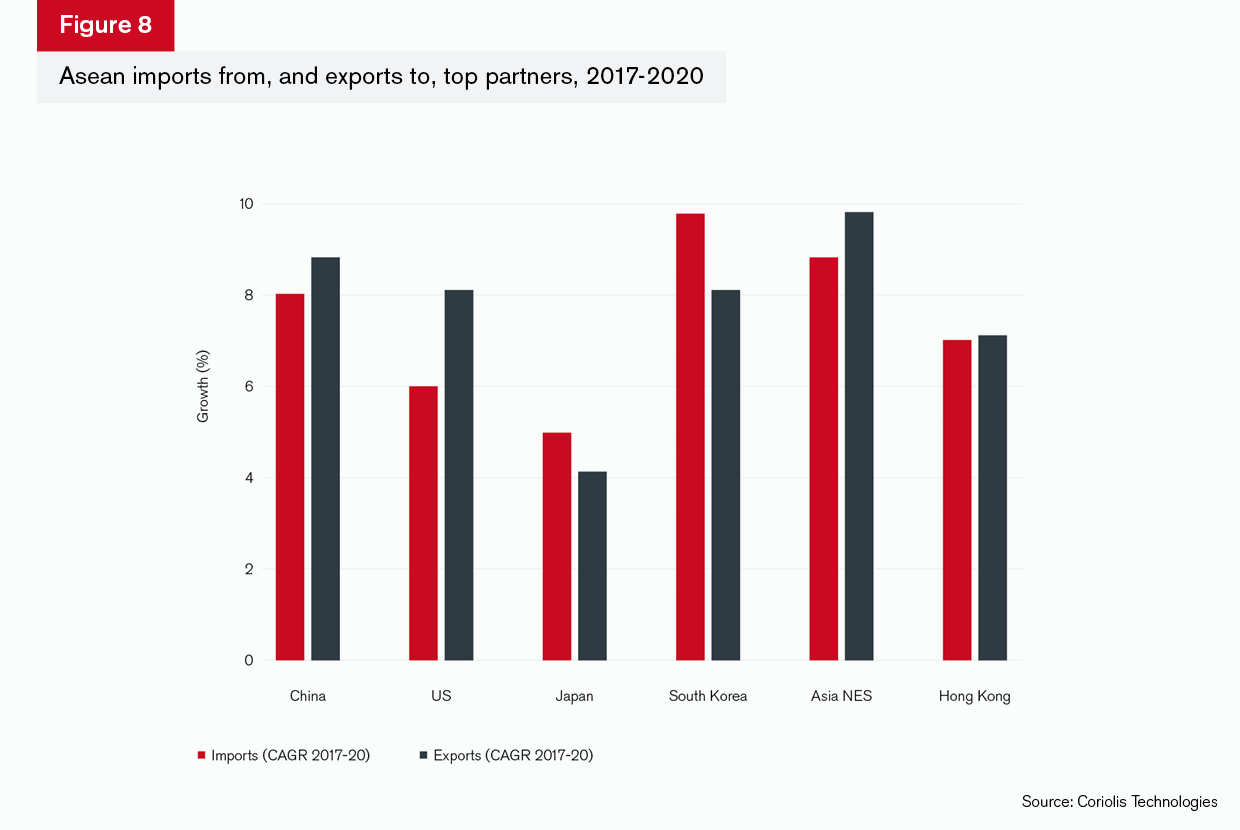
The period 2017-20 is chosen to illustrate the duration of the trade war, as tensions first started in earnest in 2017. During this time, export growth from the Asean region outwards has been strong, although is clearly focused on the broader Apac region. However, even trade with the US has grown and is projected to grow into 2020 by over 8% a year, which indicates that even flatter trade in 2020 because of Covid-19 will not dampen the growth trend.
The other feature of Figure 8 that is interesting, however, is Asia not elsewhere specified (NES) – this is all the smaller countries and regions within Asia that are, according to the UN, “too small or report too irregularly” to be included separately. When added together, however, they constitute Asean’s fifth-largest export partner and second-largest import partner.
Since 2017, imports into Asia NES have increased by 8.8% in value terms, and its exports by 9.8%. The top three sectors are electrical products and equipment, oil and gas and machinery and components – all of which have had either tariffs or restrictions placed on them. It is a logical conclusion, therefore, that trade is being diverted via these partners across the region to limit the impact of the trade war.
GTR: Will the Asean region become more dependent on itself as a result of the uncertainties around both Covid-19 and the impact of the trade war?
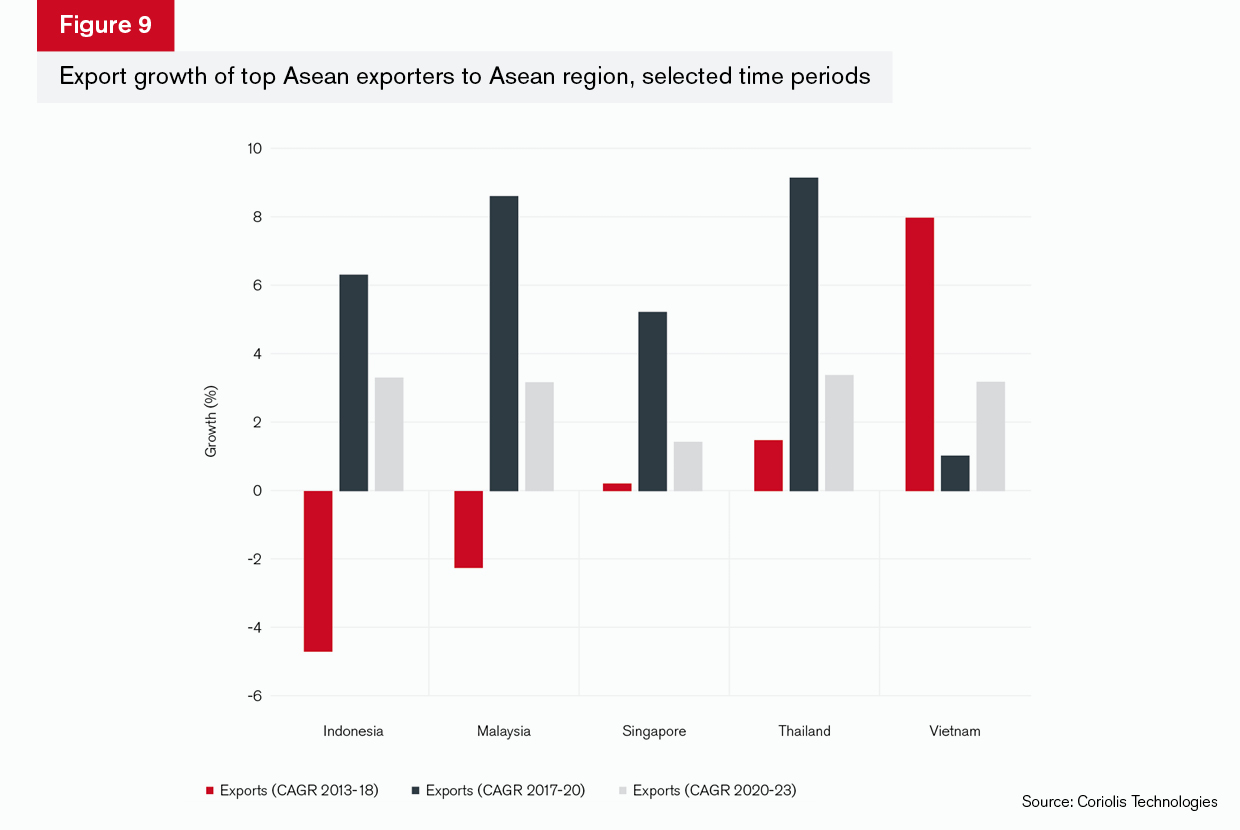
Harding: Intra-regional trade is growing across the Apac region, as has already been illustrated. There is similarly substantial growth during the key 2017-20 period from the Asean region’s top five exporters to other countries within Asean that represents the onset of conflict between China and the US.
What is interesting here is to look at the overlaps between the time periods. Export growth to other countries in the Asean region has generally been stronger for every country during the trade war period compared to the 2013-18 period. Vietnam is a notable exception, and this represents the strong growth in trade between China and Vietnam referred to previously and associated with the outsourcing of Chinese supply chains as labour costs in China rose during that period.
Indonesia and Malaysia are both commodities exporters and the decline in exports in the 2013-18 period is because of the collapse in oil and soft commodities prices. These picked up in 2018 and the faster growth in 2017-20 is because of that, rather than because of greater interdependency within the region.
However, it is likely that the region will be affected by a broader trend globally towards greater distribution of supply chains. We are already seeing a pattern evident in the data that indicates that trade and supply chains within regions are growing. The Covid-19 crisis has demonstrated that dependency on one source presents risks to the trade system globally and, for this reason, it is inevitable that this pattern will continue even if after the first period of catch-up the rates of growth slow.
GTR: China has for a long while been building its Belt and Road and Made in China 2025 strategies. Are these sustainable in light of Covid-19?
Harding: China’s Belt and Road Initiative (BRI) and Made in China 2025 strategies have dominated the trade debate in the last few years. This is not just because of the amount of money that has been invested – somewhere between US$1tn and US$8tn according to some estimates and depending on the number of countries that are included.17 Rather, it is because these strategies have very explicitly shown the US in particular that China’s intention is to grow its global influence through trade and reduce its own dependence on the developed world for supplies of high-value products and services: pharmaceuticals, automotives, aerospace and weapons. Alongside these strategies, to export its growth model across the region and to reduce its dependency on suppliers outside of the region through a focused and targeted industrial strategy, it has also invested heavily in military hardware and software.
The approach has created a perceived threat to the US and, hence, has triggered the trade and technology wars that we are witnessing now. In 2016 when President Trump came to power, he overtly stated the intention of the US to move away from Obama’s “pivot to Asia” strategy, giving the Chinese government an opportunity to step into the strategic breach economically and become equally voluble about its growth intentions.
However, China’s growth has been fuelled by substantial levels of debt. The IMF estimates that Chinese debt in 2018 was over 250% of GDP18 while growth in tax receipts fell to 4% in 2019.19 The viability of the BRI has been questioned ever since it became obvious that this was China’s approach. The world, used to a China with a foreign policy mantra of “hide your light, bide your time” has become wary of the China under President Xi, which is loud and expansionist in tone. However, China’s approach is highly strategic, and while it might be shouting about what it is doing, exactly the reverse may be happening.
In fact, during the very time period that there has been so much concern about the BRI and its expansion, the US-based Global Investment Tracker records declining BRI investments after 2015 (Figure 10). The data for 2020 are only for the months to June and unsurprisingly show a substantially lower level of investment to that point. But even weighting up for the following six months, there are indications of a drop in overall investment in 2020 that is in line with the general pattern of declining investment in the region.

In the end, it is likely that China will want to continue with the BRI as the global economy recovers. However, the way it is articulated as a strategy will be dependent upon the way in which China’s relationship with the rest of the world develops. Its focus is on building its model of economic growth and development across the region and beyond – the New Silk Road – while catalysing its self-sufficiency through long-term investments in technology, medicines, and aerospace manufacturing. This will not change, but the way it articulates its approach may, should the regime in Washington change at the next election.
GTR: US policy towards Hong Kong has changed – how will this affect its role as a trade and financial hub in the region? Are other countries likely to benefit?
Harding: The Hong Kong Autonomy Act signed into US law on July 14 imposed sanctions on individuals and entities for “contributing to the erosion of Hong Kong’s autonomy”, and removed its special status in relation to trade, economics and “sensitive” technology exports from the US to the territory.20 In effect, this meant that Hong Kong would no longer have preferential tariffs or a separate customs framework when dealing with the United States.
The measures are likely to have little effect on Hong Kong’s growth as an export hub for goods generally (Figure 11).
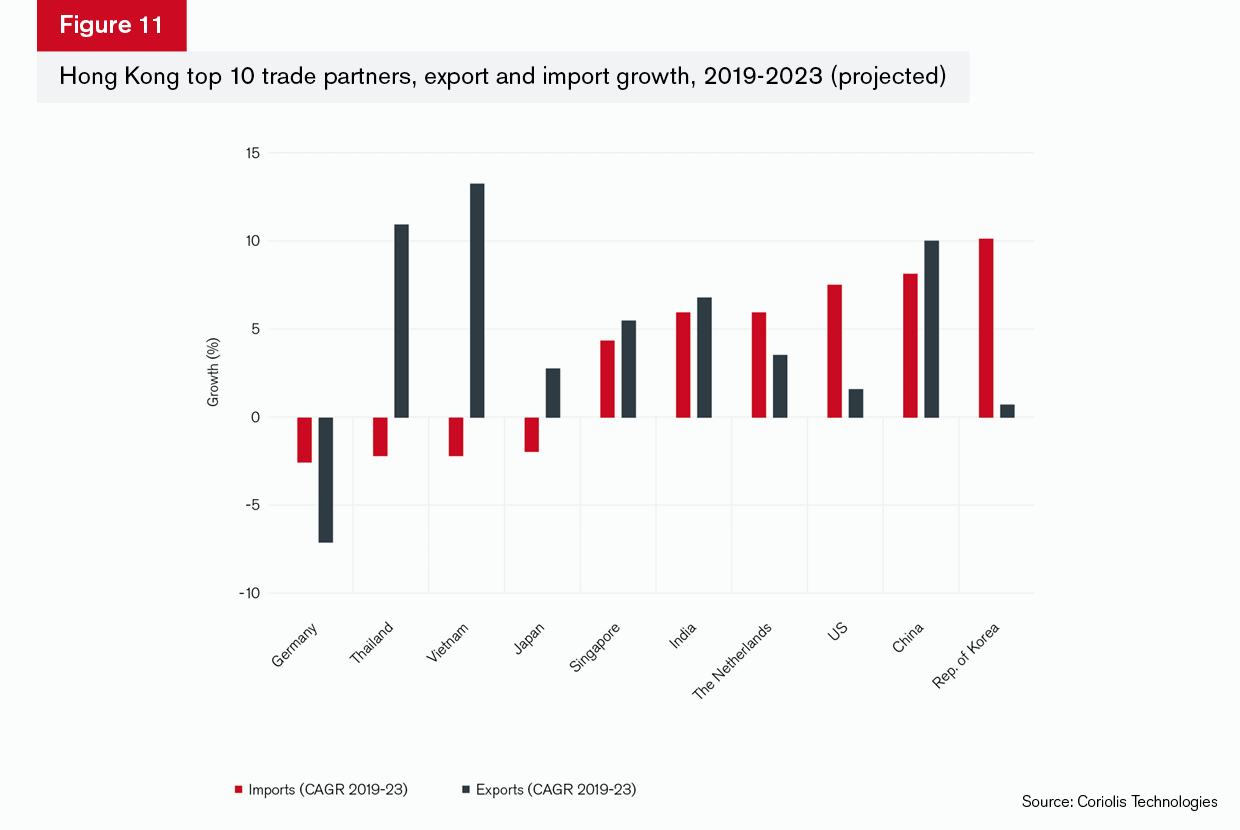
Hong Kong has historically acted as a hub for the distribution of goods from outside the Apac region to China and across Apac. Seven of its largest export destinations are in Asia, and imports are likely to fall back for three of those: Thailand, Vietnam and Japan. However, exports from Hong Kong to every destination except Germany are likely to grow, although it is worth noting that for the US and US-aligned countries – Japan, the Netherlands and Republic of Korea – the growth is not as high as export growth is to other Asian economies.
The chart excludes Areas NES – Hong Kong’s fourth-largest trading partner for imports – because it is not in the top 10 for exports. However, this is an important trading partner because it is a useful catch-all for trade that has been diverted, perhaps because of sanctions or to avoid tariffs, as suggested before. Imports from Areas NES are likely to grow over the same period at an annualised rate of 3.4%.
The main impact may well be felt in Singapore, since Singapore and Hong Kong have developed over the past 30 years as rival trade hubs. Singapore’s trade generally is more regional; nine of its top 10 export partners are in Asia, for example. The growth in exports from Hong Kong to Singapore is strong at an annualised rate of 5.4%. What is more interesting, perhaps, is that Areas NES is a larger partner for Singapore (Figure 12) and is showing the fastest rate of projected growth to 2023. This indicates that there is some trade diversion that is already starting to happen across the region in response to greater tensions.
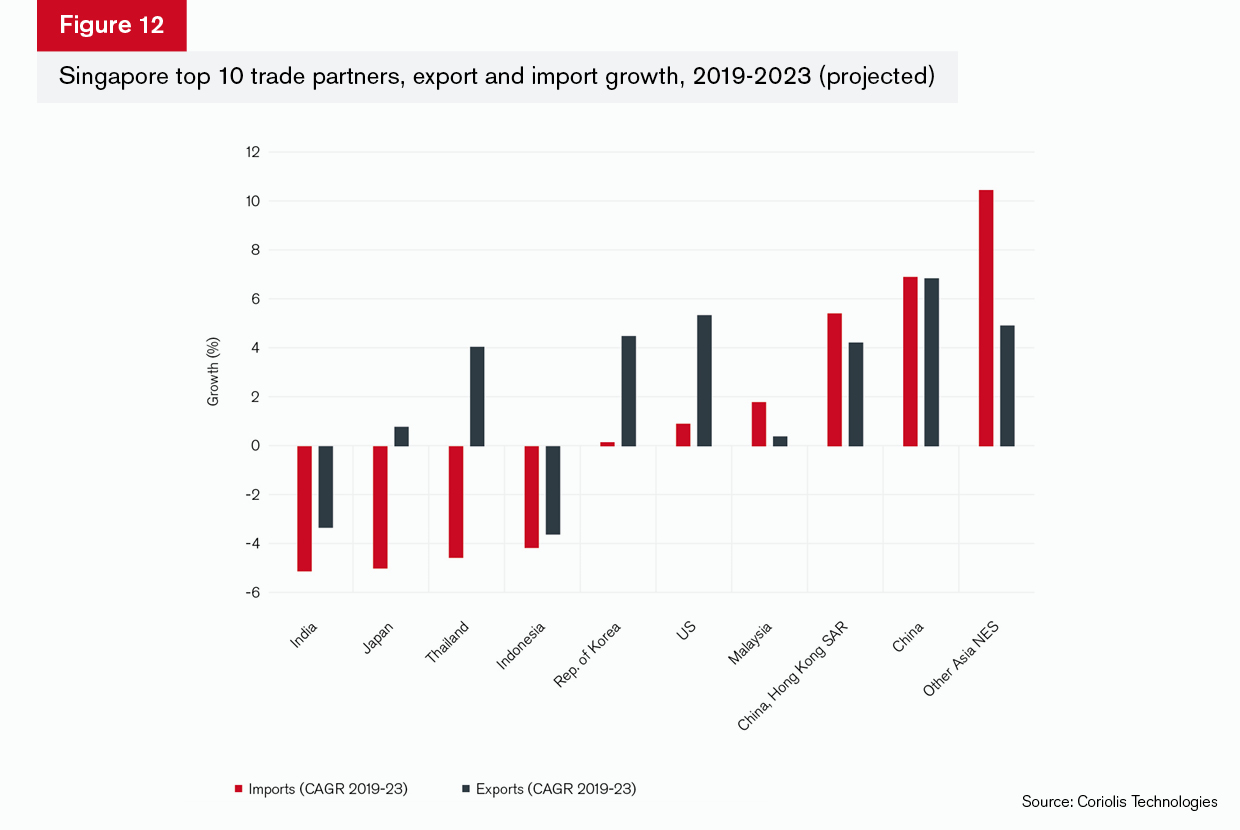
The only non-Asian country in Singapore’s top 10 export partners is the US. Its exports to the US are likely to grow at over 5% compared to more modest growth from Hong Kong of 1.5%. Hong Kong’s exports are higher to the US at some US$41.3bn in 2019 compared to Singapore’s exports to the US of US$32.1bn. While the difference may simply be due to the fact that Singapore is growing from a smaller base, this may be an emerging route for the US to trade with Asia that avoids both Hong Kong and the South China Sea directly.
Singapore’s trade with Hong Kong and China in import and export terms is set on a significant growth path as well, and this is perhaps as important. What it suggests is that Singapore is becoming more closely integrated as a trade hub for the region.
The real motivation behind the move to take away Hong Kong’s special status, however, was arguably to reduce the probability of the US’ sensitive technologies being made available to Chinese-associated businesses. There are several factors from the data for services and dual use goods to consider when assessing the likely outcome of the measures: Hong Kong’s service sector trade with China is dominated by travel and transport. It has been growing but at a declining rate since 2016. While we are expecting this slowdown to reverse in the coming years, annualised growth in the three years to 2020 is still negative at -1.23%. Growth in telecommunications services exports to China has also been shrinking at a similar pace. This suggests that China’s self-sufficiency models have been working to reduce its dependency on Hong Kong.
Hong Kong’s exports in services to the United States were worth US$10.2bn in 2019 and imports were worth US$14.1bn. The US is Hong Kong’s second-largest service sector trading partner after China, and the relationship is dominated by transport and financial services. Financial services imports from the US to Hong Kong are around US$2.1bn and have been falling over the past 10 years. Exports are worth around US$1.7bn and have also fallen back. This is not because the relationship between the two countries has become less important but rather because US entities based in Hong Kong have regional headquarters there. This allows them to trade in Hong Kong dollars, which are pegged to the US dollar. Any relocation would mean a location in Asia without these advantages so, although there were signs of a limited drop in investment in Hong Kong in 2019 of 4%, it is unlikely that these businesses will want to shift altogether.21
Finally, China is by far the biggest trading partner in terms of Hong Kong’s trade in electronic, telecommunication and IT-related dual use goods. That trade flow was worth US$123bn or over half of Hong Kong’s total dual use goods exports in these sectors in 2019. It has barely grown over the past five years, however: the annualised growth rate is just 0.1%. Similarly, US imports of dual use goods in the telecommunications and IT space has fallen by 1.9% annually and stood at US$7.2bn in 2019. All this suggests that, in physical hardware and services trade at least, treating Hong Kong as part of China is unlikely to make much difference to overall trade.
GTR: Recent years have seen rapid growth in the digitalisation of both trade and the finance that supports it. Is this trend at risk as the US seeks to decrease its reliance on Chinese technology?
Harding: Digital trade finance offers the potential to reduce costs for banks in onboarding clients and supporting trade finance solutions. As a result, it is heralded as the means for increasing access to trade finance for SMEs 22 and of helping to achieve the sustainable development goals by providing access to finance to sustainable businesses across the world.23 Perhaps because the market is bigger, it has grown more rapidly in Asia than elsewhere around the world following regulatory commitments from the Hong Kong Monetary Authority (HKMA) and the Monetary Authority of Singapore (MAS) to work with blockchain solutions such as Contour and R3, and investments from an assortment of global trade finance banks, including HSBC, BNP Paribas, ING and Standard Chartered, as well as the People’s Bank of China.24 However, this does not mean that the process has been seamless, and the current technological and financial tensions between the US and China threaten the progress that has been made so far. The ICC’s digital trade finance committee highlights the need for standardisation – banks must accept electronic documents and data as well as paper versions, and rules and connectivity between technologies and systems need to be harmonised not just for compatibility, but also for uniformity across regulatory environments.
This presents the real challenge in the current environment. A large proportion – US$700bn – of the global trade finance gap of US$1.5tn is in developing Asia, and that market will remain under-served if there is no agreement on common rules and standards.
Worryingly, the world of sanctions and compliance is becoming more complex because of reciprocal restrictions on technologies and intellectual property (IP) transfer which has taken hold during the pandemic. The phase one agreement between China and the US was remarkable for what it left out on IP protection and perceived cyber-theft; perhaps as a result of this, technology tensions between the two have not been in the form of trade negotiations but instead have taken the form of sanctions and prohibitions from the US Department of Commerce in the first instance.
This represents a real challenge for trade finance banks, both in Asia and beyond. Trade and supply chains are intrinsically international and therefore need to work within common compliance and regulatory standards, with identical requirements around transparency. As sustainability and developmental objectives start to be required by international regulators, this leaves the banks themselves on the frontline of the evolving trade and technology disputes between global super-powers. The need for supply chain transparency and the imperative to streamline technologies to ensure that the systems are secure, compliant and efficient creates a regulatory burden for banks that will prevent the adoption of digital technologies unless this apparent impasse can be resolved.
At present it seems that governments are trumping global governance. As the world of trade attempts to reboot itself through greater use of digital technologies as we emerge from the pandemic, this is a pressing issue that should be pushed up the policy agenda.
- https://www.globaltradealert.org/global_dynamics. While this number is lower than previous years, the latest data is to August 2020 rather than for the full year.
- https://www.cnbc.com/2020/05/13/trump-on-china-100-trade-deals-wouldnt-make-up-for-coronavirus.html
- Harding, R (2020_1): “Gaming Trade: Why Huawei is just the start”: https://coriolistechnologies.com/gaming-trade-why-huawei-is-just-the-start/
- https://asia.nikkei.com/Business/Finance/US-threatens-to-cut-off-Chinese-banks-access-to-dollars
- https://www.reuters.com/article/us-united-states-china-debt-breakingview/breakingviews-america-could-actually-shirk-its-debts-to-china-idUSKBN22G05Q
- Harding, R (2020_2): “Where does trade go from here?” https://coriolistechnologies.com/where-does-trade-go-from-here/
- Lighthizer, R. (2020): “How to set world trade straight”, Wall Street Journal, August 2020. https://www.wsj.com/articles/how-to-set-world-trade-straight-11597966341
- https://www.globaltradealert.org/latest/state-acts
- https://www.reuters.com/article/us-china-australia/china-warns-of-shadow-over-ties-with-australia-tells-it-to-stop-whining-idUSKBN25M0MH
- Financial Times: Coronavirus economic tracker: https://www.ft.com/content/272354f2-f970-4ae4-a8ae-848c4baf8f4a
- Financial Times, Rana Forooha (September 2020): https://www.ft.com/content/371e139e-df4d-4ef8-9ed9-a92b97543af6
- King, Stephen D (2013): When the money runs out: the end of Western affluence Yale University Press
- For details on the location of Covid 19-related supply chains and trade across the APAC region and beyond see the Asian Development Bank’s covid-19 supply chain mapping tool: https://www.adb.org/multimedia/scf/#/
- This is shown by the ITC’s market access map: https://www.macmap.org/en/covid19, and corroborated by the Global Trade Alert as well as the ADB’s Covid 19 supply chain map
- UNCTAD World Investment Report: https://unctad.org/en/PublicationsLibrary/wir2020_en.pdf
- Ibid for Asian data; Chinese government data on inward investment are reported in Trading Economics: https://tradingeconomics.com/china/foreign-direct-investment
- https://www.businessinsider.com/what-is-belt-and-road-china-infrastructure-project-2018-1?r=US&IR=T
- https://www.imf.org/en/News/Articles/2019/08/09/na080919-chinas-economic-outlook-in-six-charts
- https://www.wionews.com/world/chinas-debt-trap-increases-amid-budget-deficit-bri-roadblock-312031
- https://www.china-briefing.com/news/us-revokes-hong-kongs-special-status-implications-trade-business/
- https://think.ing.com/articles/hong-kong-impact-of-losing-special-status-from-us
- https://iccwbo.org/global-issues-trends/banking-finance/icc-digitalisation-of-trade-finance/
- https://www.weforum.org/agenda/2020/02/exporters-mind-trade-finance-gap/
- https://www.euromoney.com/article/b1cbv10dhmrs9k/trade-finance-survey-2019-asia-finds-a-block-in-blockchain