Rebecca Harding, CEO of Coriolis Technologies, discusses the outlook for the UK’s trade position, its projected growth and the impact of Brexit.
GTR: What is the strength of the UK’s trade position?
Harding: The UK’s trade position in 2017 improved. However, the numbers differ somewhat: the Office of National Statistics (ONS) reported a 10% increase in the sterling value of goods exports, while the Coriolis Technologies estimate, which is based on a standardised US dollar value related to the value of goods going through customs, reports an increase of nearly 7.5%.
According to our analysis, UK goods exports increased slightly at 0.78% to US$443.8bn between 2016 and 2017, meaning that the gap in the balance of trade for goods narrowed by 11% to some US$200bn, compared to US$225bn in 2016. Services exports grew by just over 7% in the same period to a value of US$357.4bn and a surplus of US$144bn.
But as the UK heads towards a potential Brexit on the March 29, the strength of the country’s trade position becomes even more important, and taking a longer-term view of trade becomes far more significant than analysing year-on-year changes.
The closely-watched trade deficit for goods and services is a case in point. Strong imports reflect strong domestic demand but may also grow in value terms when the currency is weaker, thus widening the deficit if exports do not grow at a similar rate. Conversely, strong export growth will close the trade deficit if domestic demand does not simultaneously pull in more imports. Export growth can be the result of more competitive exports if sustained over time, but equally it can be a short-term response to currency fluctuations.
Since 2011 the trade deficit has narrowed slightly. However, in 2017 it was 16% higher than it was in 2015 – a result of currency volatility rather than competitiveness. So, in the period since the financial crisis, the size of the trade deficit has fluctuated over short-term periods, and not just because exports have grown.
Looking longer term, over the past 10 years, however, the trade deficit has remained reasonably consistent and last year’s change was as much to do with the weakness of sterling in relation to the US dollar as it was a real gear change in UK exports.
Much of the UK’s resilience to economic challenges will be determined by the strength of its trade position, not least because the country is so dependent on trade. There are a few factors to consider in this regard:
- The UK is increasingly open to trade: its ratio of total trade (goods and services exports and imports) to GDP is 62%, which is significantly higher than the US (27%), which has a strong domestic base, but less than Germany (87%), which has a large trade surplus and relatively saturated domestic demand. The UK’s position is similar to that of Canada (64%), France (63%) and Italy (60%), and suggests that it is dependent on trade as a driver of GDP.
- In the UK there is a big gap between the proportion of overall trade in relation to GDP, and goods trade as a percentage of GDP. UK merchandise trade is just 41.5% of the value of UK GDP and the gap between that and overall trade, at over 20%, is accounted for by services trade. This is the largest difference of these values in the G7; France has a gap of 18.5% while Germany’s is 15.9% and the US, 6.6%.
- Both imports and exports have grown as a proportion of GDP: the figure was 56.5% in 2015. This suggests that the UK has become more reliant on trade through key sector supply chains and because domestic demand is met through imports: 48% of the food the UK consumes is imported, for example.
- There has been little precision in recording UK service sector trade. According to the ONS, Ireland, the US, Germany and France all record higher levels of services exports to the UK than the UK says it is importing from those countries. This lack of transparency means that the surplus in services may be less than is currently thought, which is a particular problem for policy as it evolves. For example, Germany and France have service sector contributions to trade that, although lower than the UK, are still high and growing. As financial services businesses visibly begin to move functions out of London, this pattern is likely to continue. Accurate measurement in the UK will be critical to understanding the impact of Brexit on UK trade and overall GDP.
- The pace of growth in exports is slowing. Over the past five years, UK goods exports have grown, on average, at a rate of 2.2% annually. This is forecast to slow over the next five years to 1.2%. Over the past five years UK services exports have grown, on average, at a rate of 5.9% annually. This too is expected to slow – to 3%. These projections are momentum forecasts and have nothing to do with policy changes as a result of Brexit. However, they do suggest that the UK is in an increasingly fragile position in terms of its trade, and while growth is likely to continue, policymakers need to be aware of the fact that it may weaken.
GTR: Are there any trade sectors or partners that have done particularly well of late?
Harding: Exports to countries outside of the EU have grown particularly rapidly over the past five years. There are two reasons: first, with the notable exception of the US, trade with non-EU partners is generally smaller than with EU partners. As a result, the changes are more pronounced. Second, there has been substantial emphasis on and policy support for exports to non-European markets since 2016 and this is beginning to appear in the data.
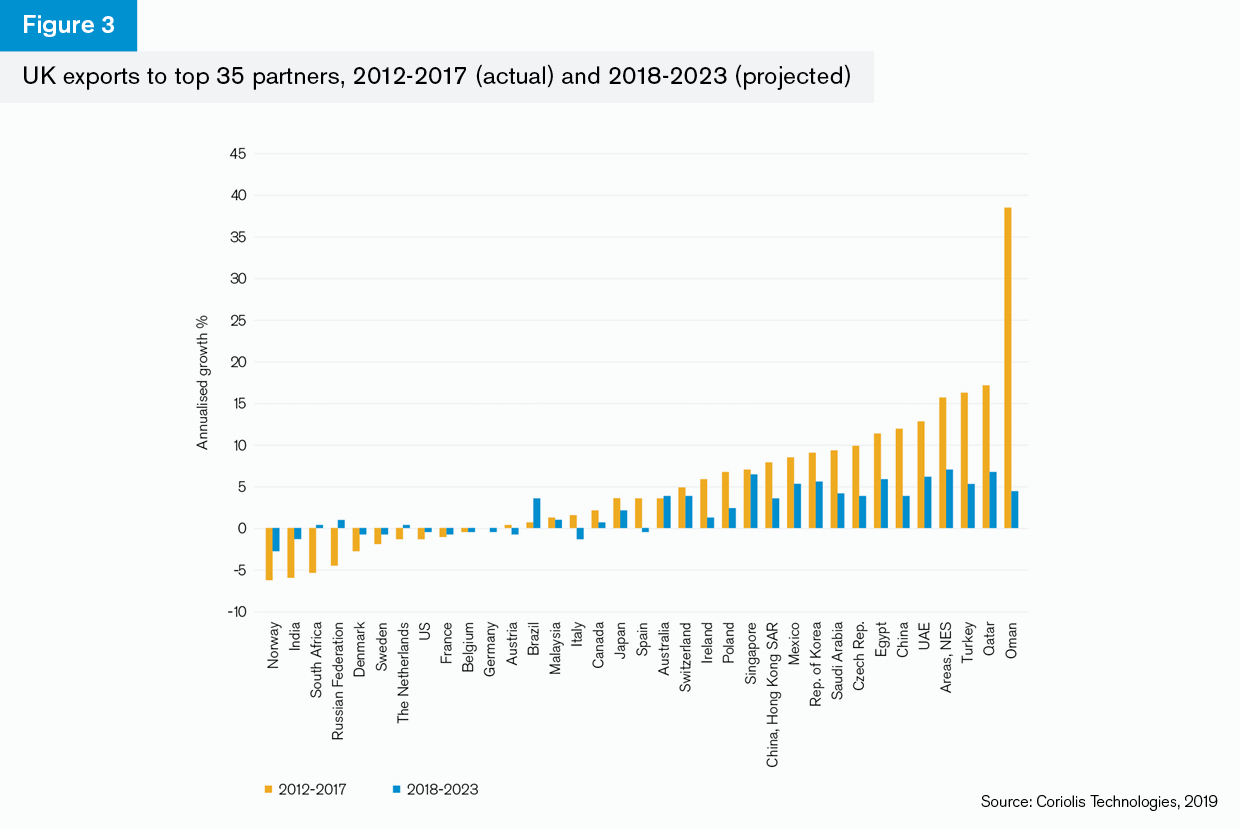
The UK’s exports to China, for example, have grown at an annualised rate of nearly 12% over the past five years. This is accounted for by an 11% increase in car exports, a 16% increase in pharmaceuticals exports and an exponential increase in exports of oil and gas of more than 50% to China over the time period. Although this trade is likely to slow over the next five years, to an annual growth rate of around 4%, this is still significant, and total UK exports to China are likely to be worth approximately US$300bn by 2022 (Figure 3).
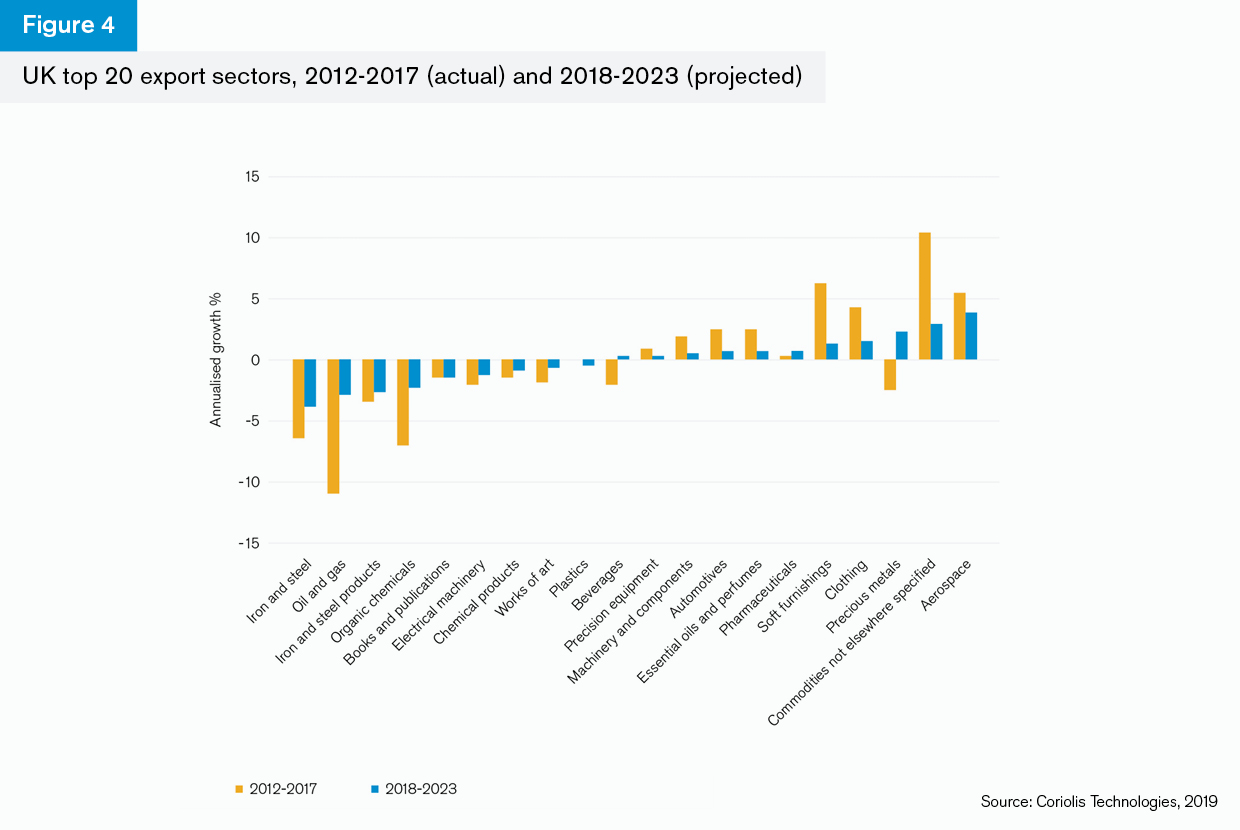
Similarly, UK exports to the Middle East have grown in the past five years at an annualised rate of just over 11%. Exports to the UAE drove much of this growth, with machinery and components exports increasing by nearly 17%, electrical equipment by 12% and precious metals by 19%.
The fastest-growing export destinations were in the Middle East, with Qatar and Oman growing at annualised rates of 17% and 39% respectively, albeit from a lower base. Although the UK’s trade is projected to slow in the next five years, exports to the UAE look like they will continue to grow substantially at around 6% a year to 2022.
Within Europe, the fastest growing-export partners over the past five years have been the Czech Republic, Poland and the Republic of Ireland at 10%, 7% and 6% annually respectively. In terms of trade with Ireland, cars, machinery and components, and plastics have shown particularly strong growth at 16%, 14% and 13% respectively. However, all are expected to slow at a faster rate than is projected for UK trade generally and this suggests that there are risks to the UK’s exports to Europe which will severely impact the trade relationship with Ireland. Indeed, exports to Ireland in electrical machinery and equipment have already fallen back at an annualised rate of nearly 5% and are projected to continue to slow at over 2% a year to 2022. Given that this sector is dominated by large US supply chains, this may indicate a weakening of the UK’s role in that sector.
GTR: How does the UK measure against other G7 and G20 members in terms of actual and projected trade growth?
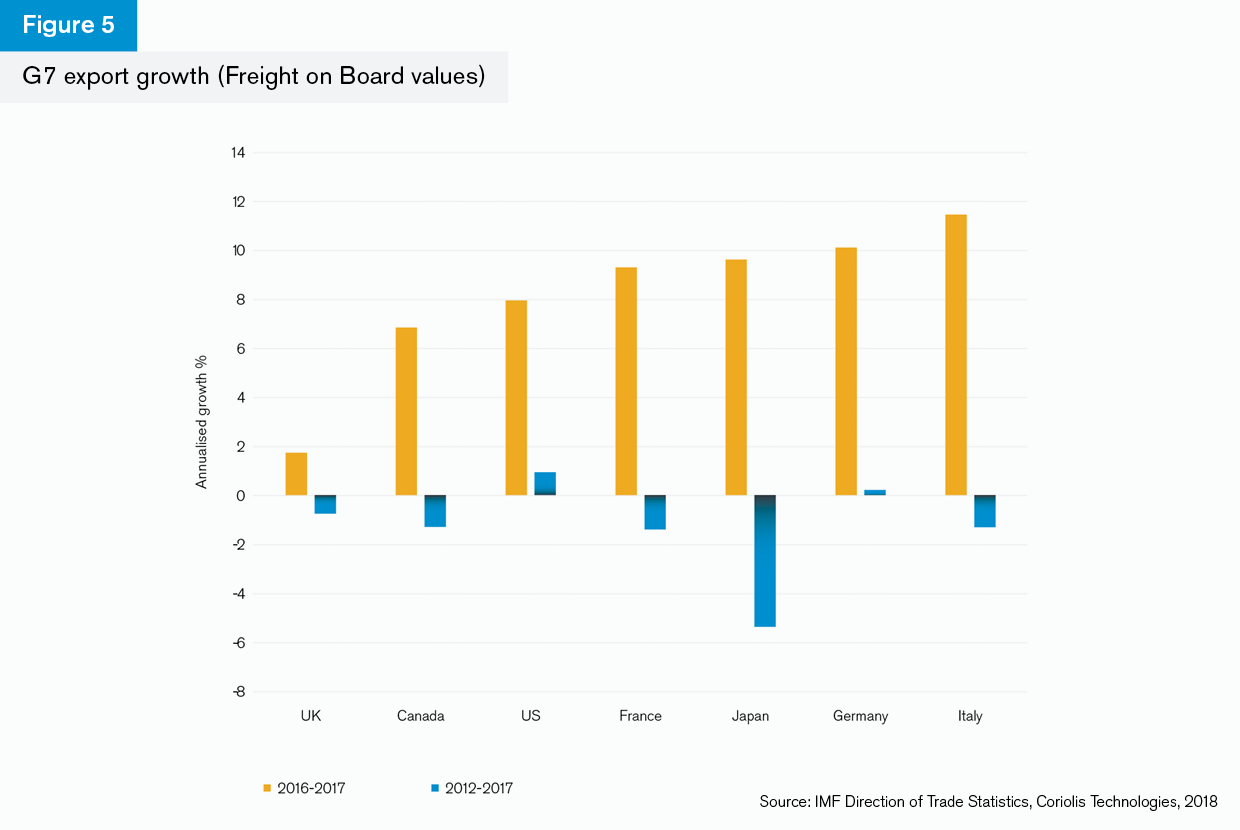
Harding: UK exports have fallen back over the past five years at an annualised rate of 0.8% and although they picked up last year, this was at a slower rate than for the rest of the G7.
This reinforces the perspective that UK goods exports are fragile. Although the rate of decline over the past five years has not been as slow as Japan, for example, it was very similar to France, Canada and Italy. The rate of recovery in 2017 was slower than it was in these countries at just 1.7% compared to nearly 7% in Canada, over 9% in France and 11% in Italy. There are many factors at play in the UK’s sluggish recovery. However, it is likely that the positive effects of stronger commodity prices and weaker sterling on exports were offset by lower demand for UK exports, such as cars to China.
A similar pattern emerges for the G19 (G20 minus the EU). Again, the UK fares relatively badly in relation to the G19 with the lowest growth in 2016-17 in terms of Freight on Board values apart from Saudi Arabia.
Freight on Board values reflect shipping costs as well as the customs value of trade. According to Coriolis Technologies data, the picture is less negative in terms of the value of goods alone. However, this does suggest that the costs of trade are high in the UK and, as these values are included in GDP calculations, it is likely that the UK’s growth will continue to be comparatively weak compared to other countries in the G19 and G7.
GTR: Which is stronger for the UK, services or goods trade?
Harding: Service sector trade growth has been more robust than that of goods trade, which explains why analysts, commentators and policymakers place so much emphasis on services and their role in the UK economy.
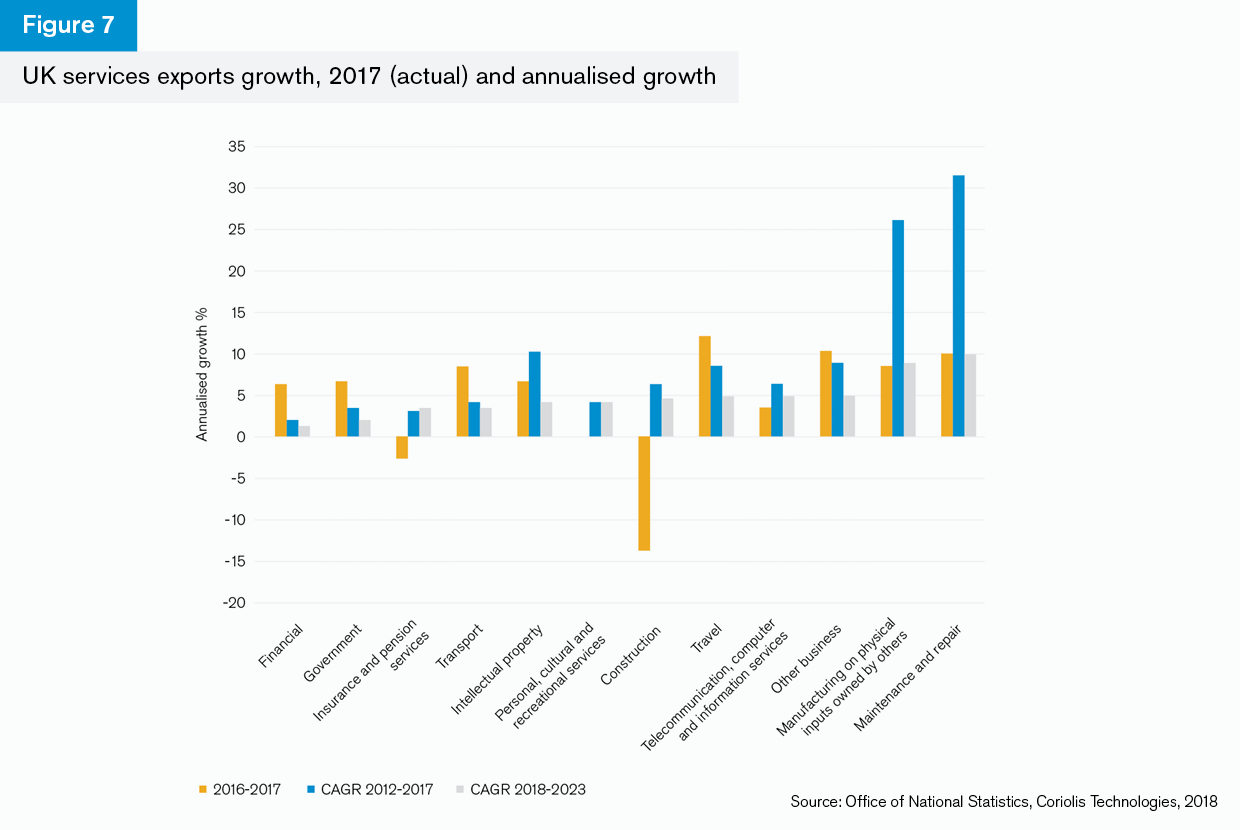
Service sector exports have grown at an annualised rate of 6.2% over the past five years and rose rapidly between 2016 and 2017. Two service sectors did not grow between 2016 and 2017: construction fell back by nearly 14% and insurance and pension services by 2.7%. However, every other service sector grew. Business services and financial services are the most prominent sectors and accounted for US$103bn and US$76bn respectively in 2017. Business services have grown at a rate of 9% annualised over the past five years and are projected to continue to grow at nearly 5% annually to 2022. Financial services have grown by 2.1% annually over the past five years and are projected to grow by 1.2% to 2022.
Although the UK has a net trade surplus in services, imports are growing rapidly. Over the past five years, imports of financial services have grown at an annualised rate of nearly 11% and intellectual property services by nearly 10%. Business services imports have grown by nearly 6% and personal and cultural services by 6.2%.
Although the outlook is positive for services, and the sector has fared well, there are number of risks on the horizon. For example – and not seen on these charts – financial services imports are set to grow at a rate of nearly 4% annually to 2022 which is twice the rate of export growth over the same period. Although this does not imply that the surplus will narrow, it does mean that the market is becoming more competitive. Further, the acknowledged gaps between what countries say they are exporting to the UK, compared to what the UK says it is importing from them, leaves question marks over the size of the surplus. The service sector may well be more fragile than is currently thought or the data suggests.
GTR: What impact has sterling’s volatility had on UK trade?
Harding: It is a trade maxim that if a currency depreciates then there will be an increase in its exports after a period of time – the price of exports becomes cheaper in other currencies and so they are more competitive on international markets. Of course, reality is never as simple as this so-called ‘J-curve’ effect: export orders can take place many months before a change in currency; the dominance of the US dollar as a global trade currency means that the exchange rate is relatively unimportant to larger, commoditised infrastructure or raw and intermediate materials exports; and the importance of global supply chains means that any currency fluctuations are hedged and therefore priced into contracts.
This helps explain why, despite the weakness of sterling since the global financial crisis, and more particularly since the 2016 Brexit vote, there has been little effect on the UK’s exports.
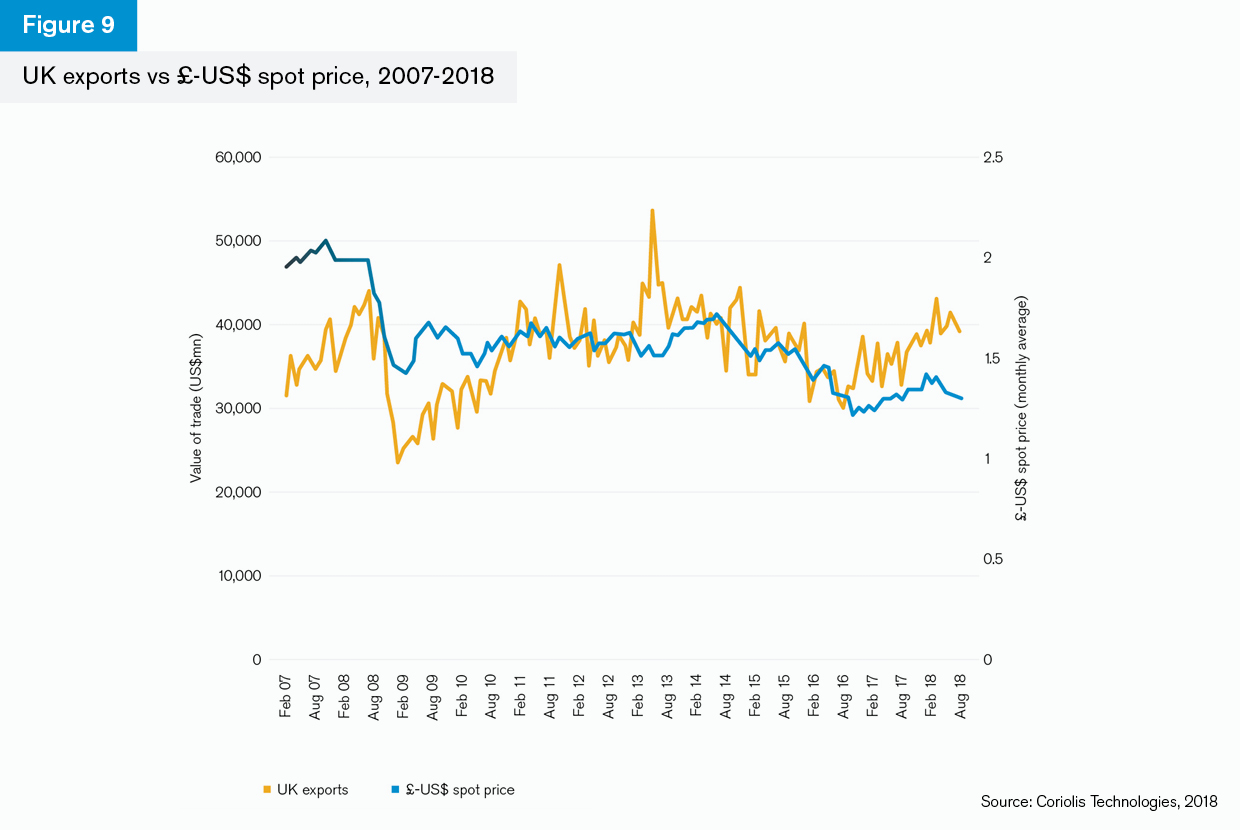
What is particularly interesting is that since the financial crisis, the correlation between the value of sterling against the US dollar and export values is weak at just 15%. Against the euro it is even weaker over the same time period at just 1%. There is a slightly stronger correlation between sterling’s value against the dollar and UK exports after the financial crisis, but since sterling’s dramatic devaluation following the Brexit vote, the value of sterling appears to have risen, as has the value of exports. In other words, particularly since the 2016 referendum, it seems that the value of trade has risen in spite of the fact that sterling has slowly appreciated in value.
Some of this is explained by the oil price. During 2017 oil prices rose and, because mineral fuels are the third-largest export sector for the UK, unsurprisingly UK trade values are much more strongly correlated with oil prices at 53%. This explains more of the shift in export values than the value of sterling does.
GTR: Are there any obvious effects of Brexit emerging in trade data?
Harding: It is not possible to conclude from the data that Brexit is having an impact on trade. The only exception may be the case of Ireland, where trade in key sectors is slowing and projected to slow.
Many of the patterns in UK trade are a function of shifts that have come about since the financial crisis. The value of UK exports is slightly higher than it was in 2007 but marginally lower than it was when trade peaked in September 2008. Since a spike in 2013, trade values fell until the latter part of 2016 and since then have increased, in all likelihood due to an increase in oil prices rather than the Brexit-induced reduction in sterling’s value against the US dollar.
There are various aspects to this:
The UK’s trade in both goods and services is forecast to grow at a slower rate after 2018 but this is in line with the projections for other countries as well.
Trade patterns and trends take a long time to evolve and the UK is currently still part of the EU as this publication goes to press. Thus, while there may be significant uncertainties in the current environment, any substantial moves in the location of global supply chains, for example, may not appear in the data for a number of years to come. Economic research suggests that around half of the changes in tariffs, for instance, work their way into the trade system over the first five years after they change, 35% in the subsequent five years and the remainder after that.
The causal relationship between changes in trade and changes in GDP is unclear: trade does drive GDP change over the long term, but in the shorter term it is more likely that trade, and particularly imports, will be dampened by the effects of sluggish GDP growth, and specifically reduced consumer demand. UK GDP growth was strong in 2013 and 2014, explaining why imports grew. GDP has grown, albeit at a weaker rate, in the last 18 months, explaining why exports have grown more rapidly.
This suggests that the effects on trade in the short term may be more likely to come from changes in GDP rather than Brexit.
GTR: What does post-Brexit trade look like in the UK?
Harding: Much of the post-Brexit structure of trade will be determined by the supply chain relationships that emerge during the course of the next couple of years. The impact of tariffs is unlikely to drive effects until after 2020, not least because as this publication goes to press, any such details remain unclear. Unsurprisingly, against this backdrop, many economic forecasts estimate the impact on trade but do not explore trade in particular detail.
Coriolis Technologies has undertaken a ‘what if’ analysis that looks at the impact on trade of several aspects of Brexit, such as higher tariffs, lower foreign direct investment (FDI), a drop in the value of sterling and reduced GDP. What’s interesting is that migration, stock markets and the value of the currency are unlikely to impact trade over a longer term period to 2022. Instead, trade is likely to be affected by changes to GDP, tariffs over a longer time period, FDI, inflation and unemployment, and base rates.
If macroeconomic factors are consistent with an average of current independent forecasts – that tariffs do not change until 2021, that FDI falls back at current rates (4% per year) until 2021 and then remains constant, and that interest rates increase to a level of 1.5% over the next two years – then Coriolis forecasts that exports will grow by just over 1% year on year.
However, if GDP grows at a slower rate of around 1.2%, FDI continues to decrease by 4% year-on-year and base rates remain at 1% after a 25% increase in base rates in 2019, then exports will continue to grow, but at an annualised rate of 0.9%. This illustrates how dependent trade is on GDP and FDI.
Digital trade is one way in which the UK’s strength may develop, and the most recent estimates of the contribution of the digital and technology sectors to UK trade suggest that some £36bn of digital services were exported in 2016. However, although digital trade in services and goods is developing rapidly across the world, the comparative statistics are very weak and it is not possible to provide robust benchmarks at present.
GTR: How are smaller exporters faring in the UK?
Harding: Smaller and medium-sized exporters drive the performance of UK at a regional level and are faring well.
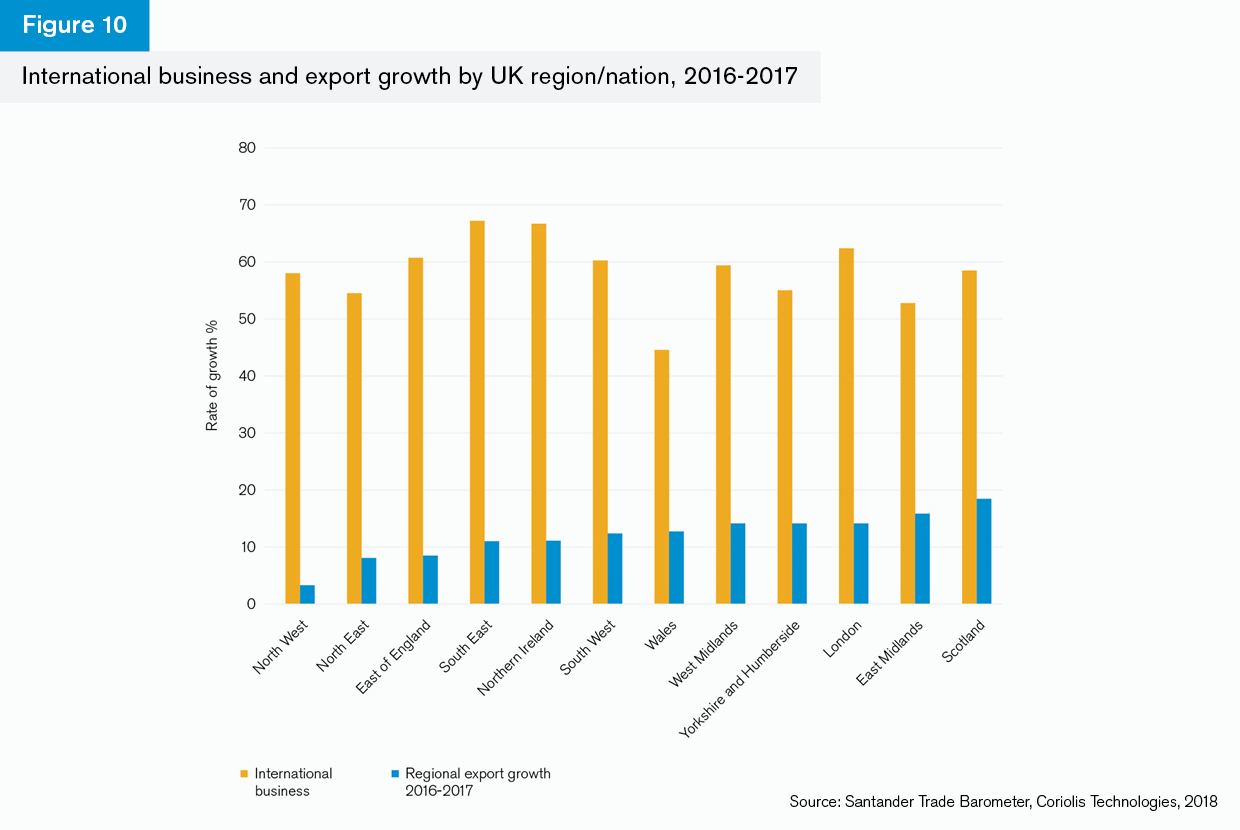
The Santander Trade Barometer has been surveying a sample of domestic and international businesses since April 2017 and has found that, throughout the period, companies have remained predominantly confident about the prospects for their international businesses. From the sample of 6,027 businesses surveyed, over 60% are confident or very confident. Two thirds of these businesses are international businesses and 90% of them are SMEs with turnovers under £500mn a year.
There are a few interesting aspects of the regional distribution of exporting businesses:
- The region with the lowest number of international businesses in the sample is Wales, but export growth between 2016 and 2017 was 12.6%, which was just above the average across the regions.
- The region with the lowest export growth between 2016 and 2017 was the North West of England.
- The region with the highest export growth was Scotland at 18.5% between 2016 and 2017. The region is dominated by oil and gas exports and has been positively affected by the increase in oil prices.
This is consistent with the overall picture of exports and imports in the UK in 2017. The South East of England has the highest level of exports, and Northern Ireland the lowest. In 2017 the only regions with a trade surplus were Northern Ireland and Scotland. In Scotland’s case, the surplus is accounted for by oil and food and beverages. In Northern Ireland, the surplus is accounted for by food and beverages, manufacturing and chemicals exports.
The performance of exporters in London, Scotland and the East Midlands is generating higher levels of growth in those regions. There are, however, a number of factors that pose risks to the current state of play, according to the Santander Trade Barometer:
- Less than 45% of businesses were concerned about Brexit over the six waves of the survey, although the results do not take into account the period around parliament’s deferred ‘meaningful vote’ or after.
- Throughout the various stages of the survey, an average of only 50% were making plans for Brexit, which included exploring possible scenarios.
- Apart from Brexit, foreign currency fluctuation and the economic performance of the UK economy were the other chief concerns of UK exporters.
What this tells us is that businesses are moving forward with their exporting plans with confidence and little regard to Brexit. In a sense, this is inevitable during a period of political uncertainty. It also helps to explain why there is little evidence of a Brexit effect as yet in the overall trade data for the UK.
GTR: What are the risks to the outlook?
Harding: The outlook for UK trade is mixed. Even under a scenario where GDP grows at a much slower rate than currently expected, it appears that goods and services exports will continue to grow.
There are, however, several risks to this growth outlook:
- Political risk: Tension in the news, as well as foreign policy risk more generally, have nearly doubled in the past year, as measured by Coriolis Technologies. Coriolis’ risk methodology tracks news stories by key word sequences that relate to foreign policy and tensions between countries. The increase is partly because of Brexit and also because key foreign policy indicators, such as relations with other countries, have deteriorated. Trade and foreign policy are ever-more interwoven with each other as trade wars and bilateralism intensify and at present the UK is one of the higher risk countries in the G7 in terms of the trade-based foreign policy risk. This creates enduring uncertainty for business and there is evidence from the Santander Trade Barometer and Confederation of British Industry data that we are starting to see a reduction in levels of investment.
- Economic risk: It is likely that GDP will have an impact on UK trade before any current Brexit-associated tariff increases start to take effect. Moreover, there is evidence from the IMF that global economic growth may start to slow during the course of the next 12 months, a result of current uncertainties caused by the trade conflict between the US and China and the potential for further interest rate rises in the US.
- Trade war and sanctions risk: The EU is working with France and Germany to develop alternatives to the US sanctions against Iran to allow it to keep on trading. However, the US is unlikely to move on the Iranian sanctions and, perhaps more significantly, may impose more substantial tariffs on the EU during the course of 2019. This will affect UK trade insofar as it is dependent on European supply chains in automotives (particularly German), pharmaceuticals, machinery and components and electrical machinery and components.
- Information risk: Too little is known about how trade is currently changing but the fact that manufacturing as a service is growing rapidly, and digital trade, however measured, is beginning to dominate the debate, means that UK policymakers may miss opportunities if data does not improve. If data remains as inconsistent, lagged and diffuse as it currently is, it is likely that businesses, banks and policymakers will make decisions that are incorrect or incomplete.


