
Ludovic Subran, Chief Economist at Euler Hermes, assesses the impact of payment behaviour and insolvencies on European and global trade.
The news around prompt payment for goods sold on credit is not great. Renewed economic growth worldwide has come with some disagreeable surprises. As inflation creeps back into the global economy, corporate turnovers may be growing, but so are input costs. The effect on company cash flow can be important, and in some cases critical, to companies’ survival. So understanding the key drivers of when you are likely to get paid, or indeed not paid at all, is vital.
Days Sales Outstanding: Who’s playing the invisible bank?
Why pay the bank for an overdraft facility when you can get your suppliers to do it for you – while they provide goods and services as part of the bargain? Happy days indeed! Unless of course, you are the supplier trying to get paid so you can pay your own suppliers.
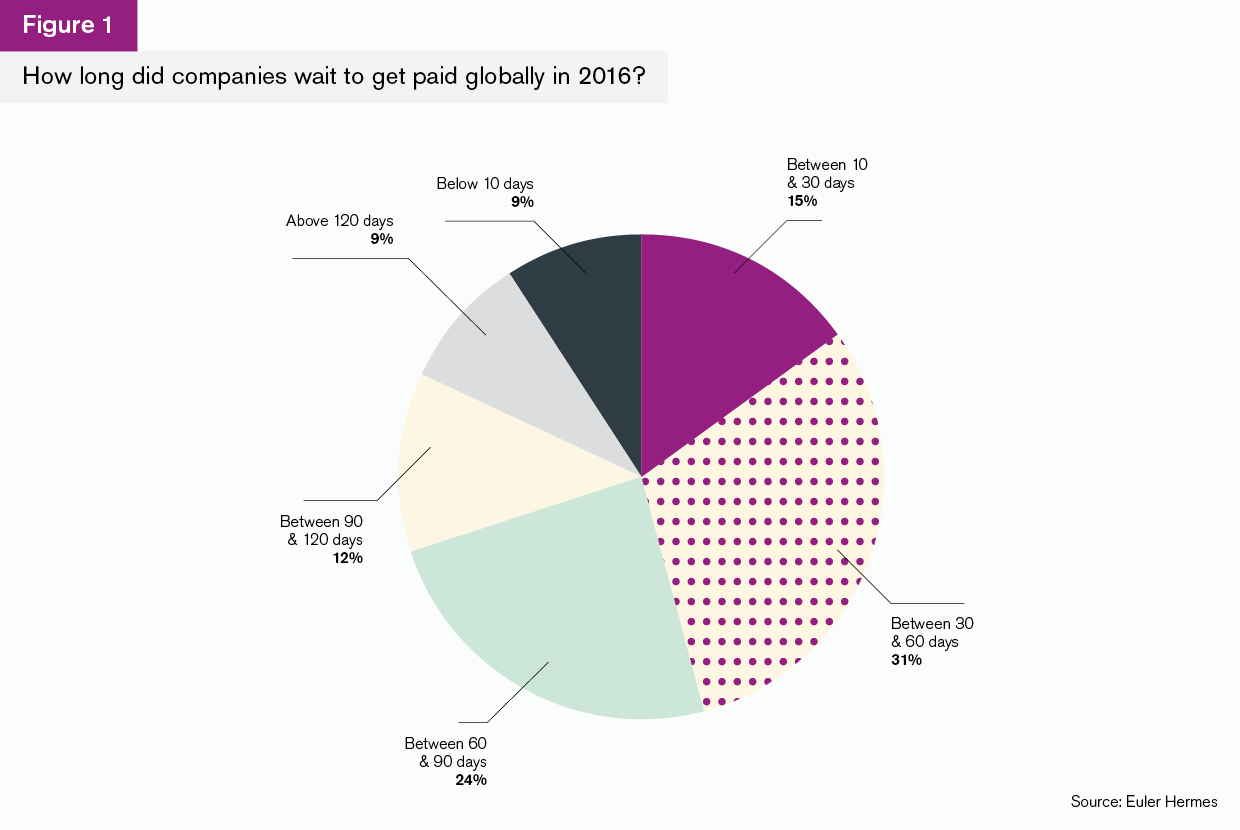
Days Sales Outstanding (DSO) or the length of time a company takes to collect revenue after an invoice, measures how long companies must wait before getting paid. Thus, DSO is a key indicator of the financial health of business partners. And the headline news is that one out of four companies worldwide has to wait at least 88 days before being paid. Significantly, one out of four bankruptcies worldwide is related to delayed payments. We’ll return later to this vicious cycle of non-payments.
But first, let us chart the landscape of payment delays.
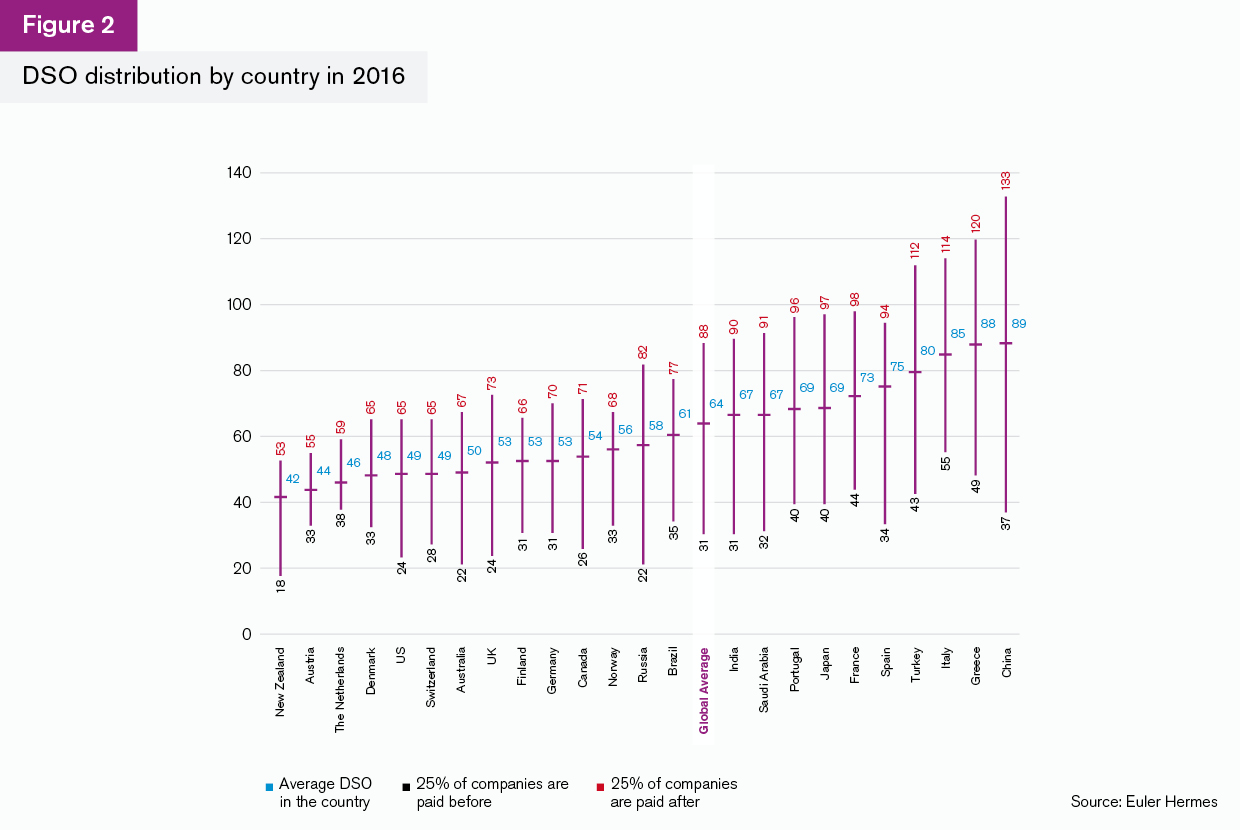
Based on a Bloomberg panel of 27,000 listed companies worldwide, the global average DSO has fluctuated around 64 days since 2010. In 2016, 25% of companies in the panel had to wait for 88 days or more to get paid by their clients while 25% were paid within 31 days. Half of the companies were paid between one and three months. A positive aspect is that the upper range of the DSO improved by two days from 90 to 88 days during 2016. Nevertheless, the time required to collect trade receivables is still very uneven across countries and sectors.
DSO levels vary to a large extent depending on the country. Four groups of countries can be broadly distinguished:
- The countries where it takes the longest for companies to get paid are Turkey, Italy, Greece and China (80, 85, 88 and 89 days respectively in 2016).
- Six further countries with a DSO above the global average include India and Saudi Arabia (67 days), followed by Portugal and Japan (69 days), France (73 days) and Spain (75 days).
- The six countries where DSO remains within a 10-day range below the global average are the UK and Germany (53 days), Canada (54 days), Norway (56 days), Russia (58 days) and Brazil (61 days).
- The seven best performers, where DSO levels are the shortest, in ascending order, are New Zealand (42 days), Austria (44 days), the Netherlands (46 days), Denmark (48 days), the US and Switzerland (49 days) and Australia (50 days).
If we look at sectors of the economy, the industries oriented towards end-consumers enjoy a shorter waiting period – with an average DSO below 60 days. In the much-disrupted retail sector, companies wait on average only 27 days. With an average DSO of 46 days in 2016, the agri-food industry cashes in on short payment terms as a result of expiration date compliance across fresh product ranges. And DSO levels in the household goods sector also benefit from the strong support of household consumption.
On the other side of the spectrum, upstream sectors such as electronics, machinery and equipment, and construction have to cope with higher DSO levels than sectors related to household consumables.
A focus on Europe
2016 saw the average DSO in Western Europe go up one day. So now European companies have to wait for 61 days on average to collect their trade receivables. This slight rise may be a signal of a real return to economic growth across European industries. This should not overshadow interesting developments within Mediterranean countries, which have succeeded in cutting DSO from very high levels towards the global average, especially in Italy, Greece and Portugal since 2015.
A DSO-level analysis shows that three existing groups of Western European countries have stood the test of time: at the favourable end are Scandinavia (Denmark, Norway, Sweden), the UK and the German-speaking countries (Austria, Germany and Switzerland). All are well below the global DSO average of 64 days. Yet, Norway and Sweden have suffered a little more than expected with their respective DSO levels rising by five and four days in 2016 vs 2015. Tumbling investment in the energy sector has taken a toll on Scandinavian companies, especially in Norway.
The second group of countries – Portugal, Belgium, France and Spain – have held their DSO back within a 10-day limit above the global average of 64 days. Spain arouses some concerns, however, as its average DSO soared by seven days over 2016. This longer DSO might be a double-edged sword: either the rise reflects real higher economic growth across Spain or a premature loosening of domestic payment discipline.
Of the last two countries, Italy has seen little change in DSO above 85 days in 2016. However, the DSO in Greece has tumbled by 16 days since 2012 to an average of 87 days in 2016. Austerity measures and privatisation have forced Greek companies to tighten the management of their trade receivables.
Russia stands out, having seen its DSO go up two days in 2016. It appears Russian companies have been more predisposed to grant longer time limits to their clients as the business environment has improved. Indeed, Russian Working Capital Requirements (WCR) have gone up by two days to 83 days following the ramp-up of recent industrial activity.
Overall, it is very encouraging that the significant gap between the three groups of major European countries’ DSO levels exceeding 90 days has been curtailed over the past two years.
Insolvencies
If extended payment terms are not enough to contend with already, what is the likelihood of your clients going bust and not paying you at all? The picture is mixed and the severity of risk to entire supply chains from the collapse of major firms is on the increase.
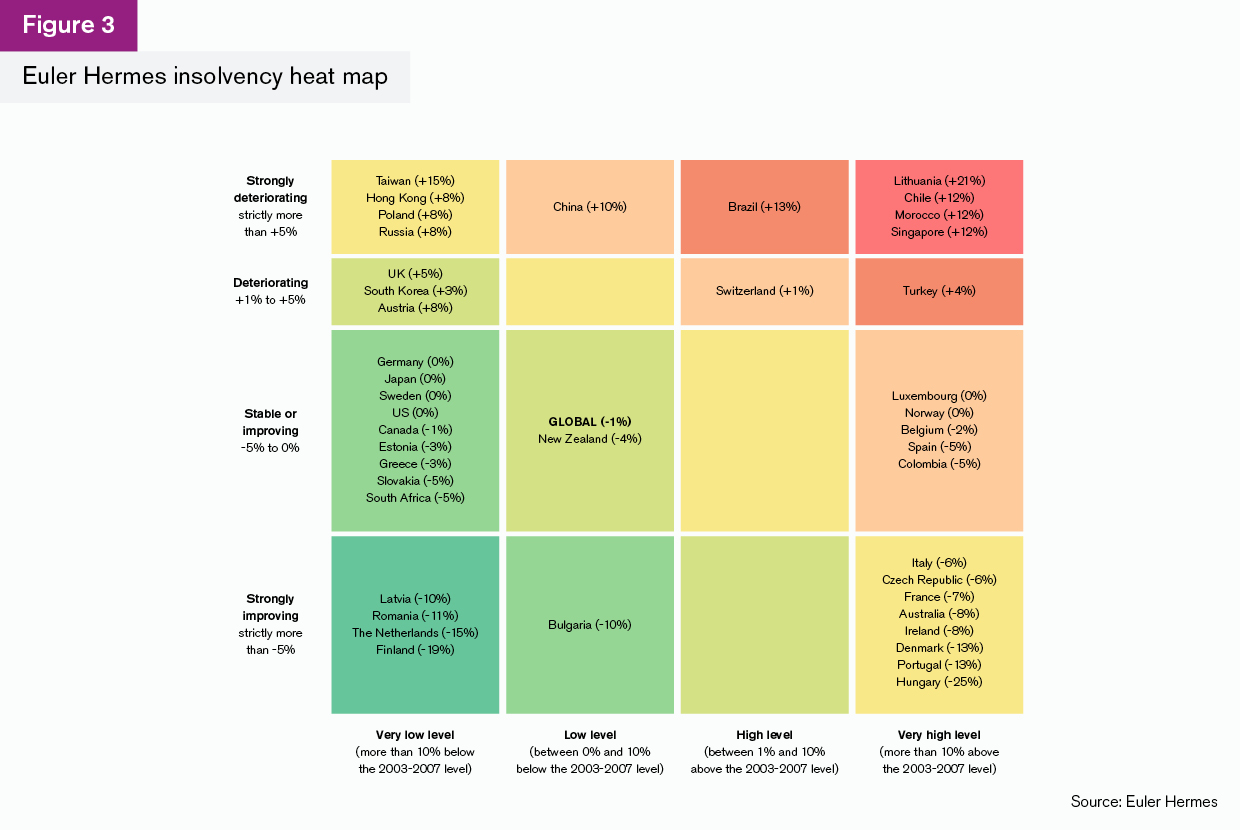
At a global level, the insolvency outlook across the 43 markets monitored by Euler Hermes is quite balanced for 2017 and 2018. After three years of substantial declines (-13.6% in 2014, -8.4% in 2015 and -4% in 2016), Euler Hermes expects worldwide insolvencies to continue their softening tempo and to increase moderately by +1% in 2018 after a -1% decline in 2017. This swing will be driven by uneven regional trends:
- First, a persistent and broad-based rise in insolvencies in Latin America (+8% and +11% respectively in 2017 and 2018), Africa (+10% and +6%) and Asia Pacific (+3% both years), since Latin American countries are barely making their way out of recession and the whole Asia Pacific region still has to adapt to the growth normalisation occurring in China.
- Second, a plateau in North America in 2017 (0%), before rising in 2018 (+5%), after seven years of steady fall to an (almost) historical low, on the back of rising interest rates, renewed tensions in working capital requirements (three out of four industries registered an increase in WCR in 2016) and business demography dynamic.
- Third, a slower pace of decline in bankruptcies in Western Europe, -5% and -2% respectively for 2017 and 2018 (compared to -16% in 2014, -12% in 2015 and -7% in 2016), while in Central and Eastern Europe (+1% and -6%) the ongoing difficulties in major countries (Russia, Poland, Turkey) will continue in 2017, offsetting the improvement in smaller countries. However in the region, the level of bankruptcies will remain high with 10 out of the 17 countries monitored still reporting more insolvencies in 2017 than registered, on average, before the crisis (over the 2003-07 period).
Overall, four main factors explain this balanced outlook for credit risk:
- global growth and trade, despite the improving trend, still suffers from out-of-sync growth engines, with Europe and the US possibly moving in opposite directions;
- recovering prices support turnovers but also squeeze margins in countries and sectors where input prices are increasing more rapidly than selling prices;
- renewed tensions in working capital requirements (for half of the industries); and
- the current rebound in large bankruptcies, ie bigger companies going bankrupt cause a domino effect on fragile suppliers.
The sharp rise in bankruptcies of large companies (turnover of more than €50mn) calls for special attention. Major insolvencies have been on an increasing trend globally in Q1 2017, as 74 companies went bust, 30 more than in Q1 2016, a 68% hike.
These failed businesses’ cumulative turnover soared by 34% to €19.1bn. The striking hike in failures of companies with turnovers from €101mn to €1bn played a preeminent role in this deterioration. Nineteen more companies in this category collapsed in Q1 2017 compared to Q1 2016. Their cumulative turnovers accounted for more than half of the global amount (€10.7bn).
Companies should beware of a domino effect, as the overall severity of failures is worsening. The spike in the number of too-big-that-failed could have serious knock-on effects on providers along the supply chain. Retail bankruptcies in the US and UK, for example, might impact textiles, electronics and manufacturing worldwide.
Insolvencies in Europe
Fourty-nine European companies closed their doors during Q1 2017, more than double the figure in Q1 2016 (24). In Central and Eastern Europe, cumulative turnovers related to big insolvent companies recorded a sharp increase of 112%, with 24 firms going bankrupt (up from nine in Q1 2016).
Failures were concentrated in Russia (10) and Poland (10). In Western Europe, 25 major insolvencies (up 66% compared to Q1 2016) were registered but no one location stands out, implying a more even spread of bankruptcies across countries in this region.
Where does this leave European trade? The answer is mixed. Based on the trends in DSO and insolvencies, collecting accounts receivables may be set to enter a new phase. Payment behaviours continue to be tense: one out of four companies worldwide are paid after 88 days. While the overall number of worldwide insolvencies is likely to stabilise over the next two years, major insolvencies pose the most serious threat, as billions of euros, pounds and dollars of cumulative turnover disappear into thin air.
The Brexit bombshell
The withdrawal notification sent by the UK government to the European Council on March 29, 2017 triggered the two-year countdown specified by Article 50. As a result, we expect the ratification of the EU exit agreement between autumn 2018 and March 2019.
Divorce talks will mainly focus on outstanding British commitments, the end of the UK inclusion in several EU institutions and the rights of EU citizens living in the UK and vice versa.
The UK economy will continue to be resilient during the negotiation period but consumer spending will take a hit from higher inflation and a slowdown in wages, and investments could go into wait-and-see mode. Overall, we expect UK GDP growth to slow down to +1.4% in 2017 from +1.8% in 2016 and to +1.0% in 2018.
The two-year timeframe is not realistic to agree on the exit deal and a trade deal. We thus expect parties to adopt a transition deal covering EU-UK relations to bridge the gap between the end of Brexit negotiations and the final trade agreement.
A final deal could come in 2021 after the 2020 UK general election. Our baseline scenario is a limited trade agreement where selective sectors would be duty-free while others would be subject to tariffs. Annual GDP growth is likely to slow down to 0.3% in 2021. In the UK, impacts would be visible on households, companies, markets and policymaking.
Investors and exporters doing business in the UK will be negatively affected through the depreciating sterling, slowing UK domestic demand and a rise in UK insolvencies (+5% in 2017 and +6% in 2018).
Looking at trade and investment relationships, the EU countries which are expected to be most affected are the Netherlands, Ireland and Belgium. Yet overall we expect a moderate impact on eurozone GDP. In addition, the loss of attractiveness of the City of London could benefit Luxembourg, Ireland, the Netherlands and Germany, in that order.
Note that a cliff-edge scenario is possible, although it is unlikely. This could come from either a lack of a transition deal in 2019 or any deal governing future EU-UK relations forcing it to trade under World Trade Organisation terms.
In both cases, disruption in trade flows will have a significant negative impact on the UK and the EU.
Overall, GDP could fall by 1.2% in 2019 and the UK might remain in recession until 2021. For UK exporters, losses could amount to £30bn for goods and £36bn for services.
For the rest of Europe, 2019 could be a particularly costly year for exporters in Germany (€8bn), the Netherlands (€4bn), and France (€3bn), as the pound loses another 20% and tariffs apply.
In the long run, even with a limited trade agreement, Brexit does mean a GDP growth average of 1.3% for the UK, below its pre-Brexit average of close to 2%. Stronger yet one-sided trade, monetary or fiscal policy boosts would have only limited positive effects.